• Entertainment
  • Finance
  • Marketing
  • Real Estate
  • Technology
  • Social
National Journal Community Of e-Experts
Finance 0

Annual, Annualized, Q4/Q4 Growth Rates: A Graphical Depiction

By Kurt Osterberg · On April 19, 2018

Why do reported growth rates differ for the same variable? Refer to the last three years of GDP data to see…

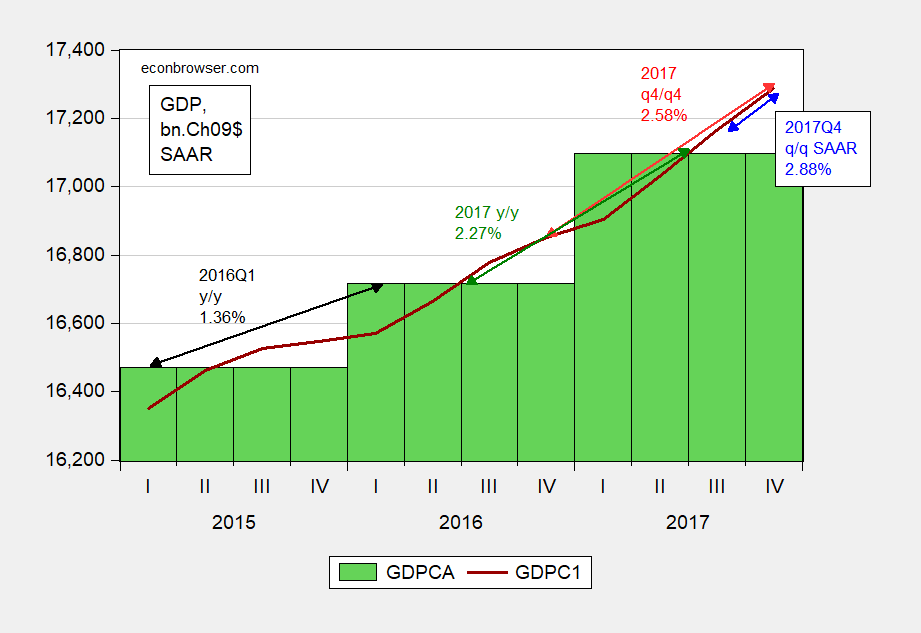
Figure 1: Quarterly GDP, SAAR, FRED series GDPC1 (blue line), annual, FRED series GDPCA (green bars), in billions of Chained 2009$. 2017 q4/q4 growth rate (red arrow); annual 2017 y/y growth rate (green arrow); 2017Q4 q/q SAAR growth rate (blue arrow); 2016Q1 y/y SAAR growth rate (black arrow). Source: BEA, 2017Q4 3rd release via FRED, and author’s calculations.

So, there are several ways to calculate the growth rate over the course of the year. They will almost invariably differ, perhaps substantially, when GDP is either growing very rapidly or shrinking very rapidly. And there is no “right” way. If one wants to calculate the most recent growth experience, one might stress q/q. If one wants to look at a longer horizon, then one might want to use the quarterly y/y. If one thinks quarterly series are very noisy, one might want to look at annual y/y.

Note: SAAR denotes Seasonally Adjusted at Annual Rates.

Additional Note: One could average the q/q annualized growth rates over the four quarters of 2017 to try to get 2017 q4/q4 growth rate. This calculation leads to an approximation, which gets worse the more variable growth rates are (unless growth rates are calculated as log-differences — which is part of the reason economists like to express variables in logs and log differences…).

Print Friendly, PDF & Email

Share Tweet

Kurt Osterberg

You Might Also Like

  • Finance

    STEPN Sneaker NFTs Sell For $100, Previously Worth $1200

  • Finance

    NFT Prices in Free Fall – 5 NFT Collections to Start Buying Today

  • Finance

    5 NFTs Trending on Twitter Going Cheap to Invest in Now

No Comments

Leave a reply Cancel reply

Top Finance

  • 3 Best Large-Cap Blend Mutual Funds For Enticing Returns 3 Best Large-Cap Blend Mutual Funds For Enticing Returns
  • What is Value Chain Analysis? How to Deliver Value & Gain a Competitive Advantage What is Value Chain Analysis? How to Deliver Value & Gain a Competitive Advantage
  • Hedge Funds In The US Hedge Funds In The US
  • 5 Ridiculously Useful Non-Monetary Reward Examples that Improve Employee Engagement 5 Ridiculously Useful Non-Monetary Reward Examples that Improve Employee Engagement
  • Chart: Amazon’s Dominance In Ecommerce Chart: Amazon’s Dominance In Ecommerce

New Posts

  • STEPN Sneaker NFTs Sell For $100, Previously Worth $1200

    STEPN Sneaker NFTs Sell For $100, Previously Worth $1200

    June 20, 2022
  • NFT Prices in Free Fall – 5 NFT Collections to Start Buying Today

    NFT Prices in Free Fall – 5 NFT Collections to Start Buying Today

    June 20, 2022
  • 5 NFTs Trending on Twitter Going Cheap to Invest in Now

    5 NFTs Trending on Twitter Going Cheap to Invest in Now

    June 20, 2022
  • Bill Gates – ‘NFTs & Crypto Based on Greater Fool Theory’

    Bill Gates – ‘NFTs & Crypto Based on Greater Fool Theory’

    June 20, 2022
  • Actor Seth Green Pays $300,000 to Recover his Stolen BAYC NFT

    Actor Seth Green Pays $300,000 to Recover his Stolen BAYC NFT

    June 20, 2022
  • About
  • Contact Us
  • Privacy & Policy
  • Sitemap
  • Terms of use

Copyright © 2018-2021 NJCEE. All Rights Reserved.