
In previous blog posts (e.g. hehe) I explained the limitations of sentiment as a market timing tool. Since the public is invariably wrong at price extremes, it certainly can be helpful to track the public’s sentiment and use it as a contrary indicator. However, whereas price extremes always coincide with sentiment extremes, sentiment extremes often don’t coincide with price extremes. This is especially the case during long-term bull markets, when sentiment is capable of staying very optimistic for years. It’s therefore best to think of a sentiment extreme as a necessary, but not a sufficient, condition for a price extreme.
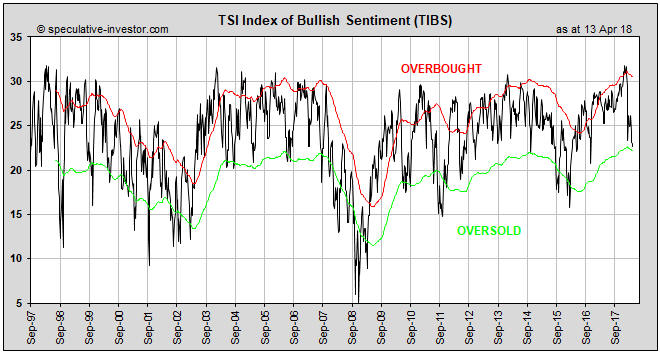
With regard to US stock market sentiment there was an optimistic extreme in January of this year. This is evidenced by the TSI Index of Bullish Sentiment (TIBS) hitting a 20-year high at that time. Refer to the following weekly chart for details. Note that TIBS is a weighted average of four sentiment surveys (Investors Intelligence, Market Vane, Consensus-inc and American Association of Individual Investors), the 5-day moving average of the equity put/call ratio and the 5-day moving average of the VIX.
What is the probability that January’s optimistic extreme coincided with the top of the equity bull market?

The answer is: quite low. While sentiment was consistent with a major top and valuations, on average, were definitely high enough to usher in a major top, an end to the long-term upward trend was not signaled by several important indicators. For example, there would normally be a pronounced widening of credit spreads at or before a bull market top, but credit spreads remain near their narrowest levels of the past 10 years. For another example, there is likely to be a reversal in the yield curve from flattening to steepening at or prior to a bull market top, but at the end of last week the US yield curve was at its ‘flattest’ in more than 10 years. For a third example, there has been more strength in market internals over the past two months than there normally would be if we were dealing with the early stage of a bear market.


No Comments