• Entertainment
  • Finance
  • Marketing
  • Real Estate
  • Technology
  • Social
National Journal Community Of e-Experts
Finance 0

Common Sentiment Indicators

By Kurt Osterberg · On April 22, 2018

 Sentiment indicators are meant to demonstrate how a group of investors and traders feel about the markets.

  • This group might be “dumb money”, which suggests that you should trade opposite to what the prevailing sentiment is.
  • This group might be “smart money”, which suggests that you should trade according to what the prevailing sentiment is.
  • The majority of sentiment indicators are “dumb money” sentiment indicators. These indicators become “optimistic” after the market goes up and “pessimistic” after the market does down. Hence, these are essentially used as contrarian indicators.

    We’ve already said that sentiment indicators aren’t the best. But if you’re still interested in them, here are some common sentiment indicators for the stock market and other financial markets. Most sentiment indicators are designed for the stock market because it captures the majority of investors’ attention. Not many mom-and-pop investors trade forex and commodities.

    Stock market sentiment indicators

    The VIX (volatility index) is the most commonly used sentiment indicator for the stock market. VIX is essentially a “fear index”.

  • It rises when the majority of investors and traders are more pessimistic and expect higher volatility in the stock market.
  • It falls when the majority of investors and traders are optimistic and expect lower volatility in the stock market.
  • In other words, VIX tends to move inversely with the S&P 500 over the short-medium term.

    VIX is based on options. VIX tends to swing within a range over the long run. It bottoms at around 10 and it rarely goes above 40.

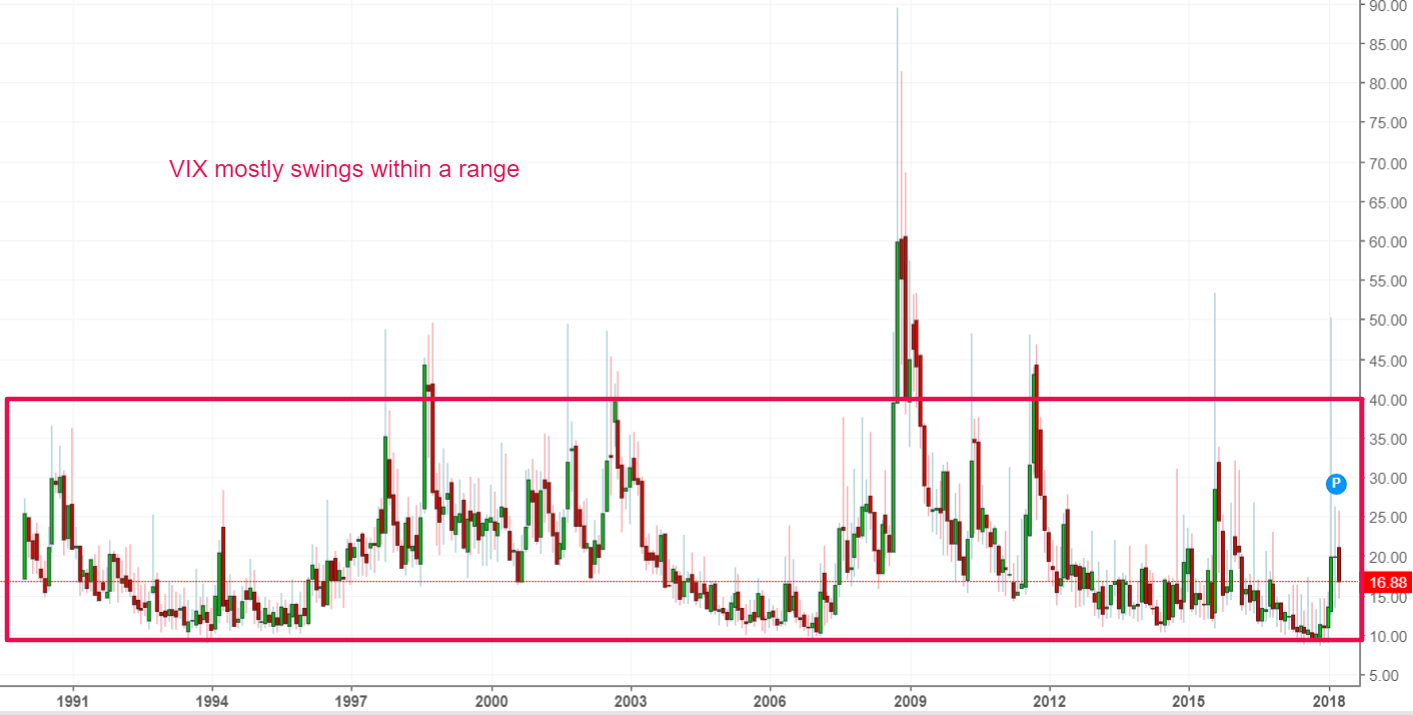
    This is a price-based sentiment indicator for the U.S. stock market. This is used as a “dumb money” contrarian indicator.

    AAII Investor Sentiment Survey

    AAII is one of the best survey-based sentiment indicators for the U.S. stock market. Every week AAII members are asked in what direction they think the U.S. stock market will go over the next 6 months. The results are compiled into Bullish, Neutral, and Bearish. Here’s what it looks like.

    Print Friendly, PDF & Email

    Share Tweet

    Kurt Osterberg

    You Might Also Like

    • Finance

      The Key to Continuing Productivity at Home

    • Finance

      Why Businesses Fail to Solve the Right Problem

    • Finance

      How to Track Business Expenses (And Why You Shouldn’t Put It Off)

    No Comments

    Leave a reply Cancel reply

    Top Finance

    • Chart: Amazon’s Dominance In Ecommerce Chart: Amazon’s Dominance In Ecommerce
    • Shark Tank Recap: Shed Defender, Tata Towels and Sanaia Applesauce Secure Deals Shark Tank Recap: Shed Defender, Tata Towels and Sanaia Applesauce Secure Deals
    • Hedge Funds In The US Hedge Funds In The US
    • One Ring To Rule Them All One Ring To Rule Them All
    • Dollar General (DG) Q2 Earnings And Revenues Surpass Estimates Dollar General (DG) Q2 Earnings And Revenues Surpass Estimates

    New Posts

    • The Key to Continuing Productivity at Home

      The Key to Continuing Productivity at Home

      January 27, 2021
    • Why Businesses Fail to Solve the Right Problem

      Why Businesses Fail to Solve the Right Problem

      January 27, 2021
    • How to Track Business Expenses (And Why You Shouldn’t Put It Off)

      How to Track Business Expenses (And Why You Shouldn’t Put It Off)

      January 27, 2021
    • How to Get More Landing Page Engagement in 2021

      How to Get More Landing Page Engagement in 2021

      January 27, 2021
    • The Power of Renewal: How to Make This Year Better

      The Power of Renewal: How to Make This Year Better

      January 27, 2021
    • About
    • Contact Us
    • Privacy & Policy
    • Sitemap
    • Terms of use

    Copyright © 2018 NJCEE. All Rights Reserved.