

Chart #1 is a monthly chart of WTIC Crude Oil (in the upper half) and the CL:OVX ratio (depicted in histogram format in the lower half).
As I’ve noted recently, the major price resistance and support levels are 80.00 and 60.00, respectively.
Corresponding to those are the major ratio resistance and support levels of 3.00 and 2.00, respectively. In this regard, it will be important for the ratio to remain above 2.00 and the ratio 5 MA to remain above the 8 MA to confirm an upward bias on Oil on this timeframe.
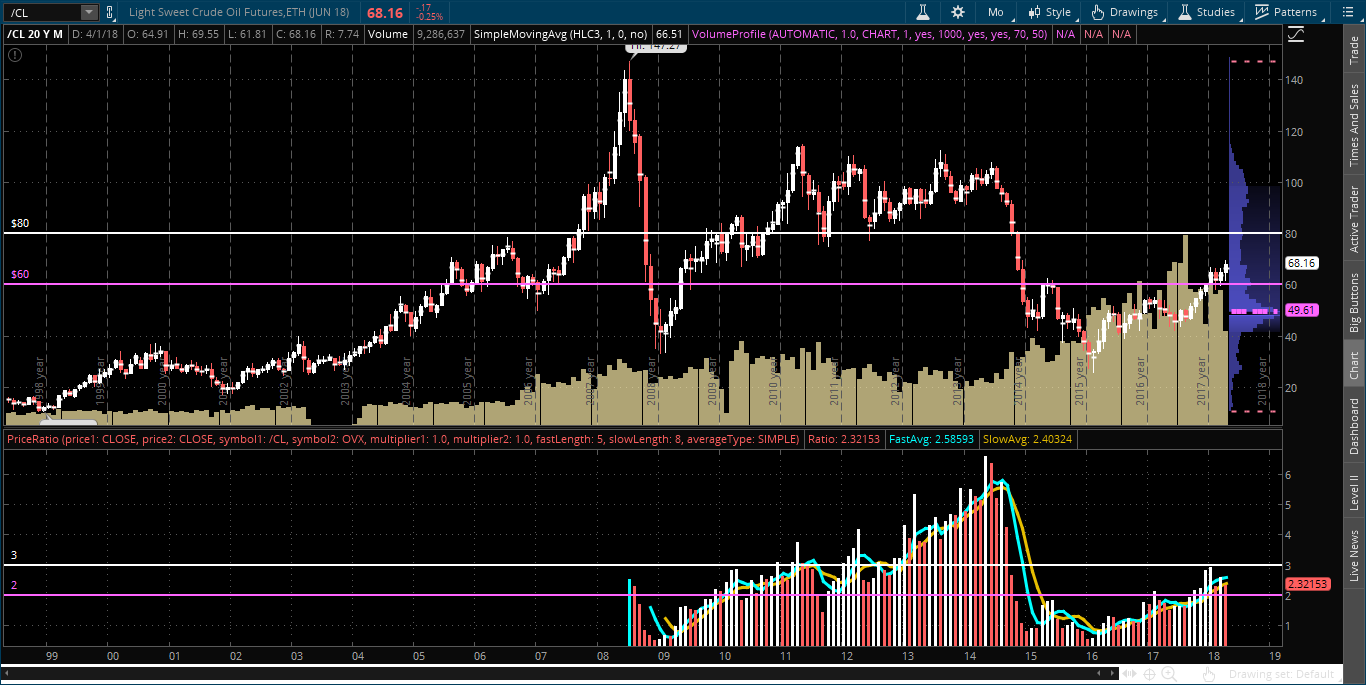
Chart #1
Chart #2 shows this ratio in candle format on a daily timeframe.
In the short term, watch for it to break and hold above its 50 MA, for the RSI to pop and hold above 50.00, and for the MACD and PMO to form bullish crossovers in order to confirm such upward bias.
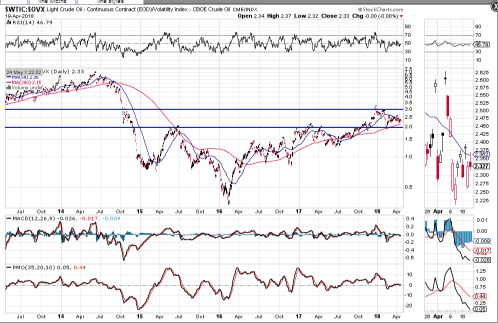
Chart #2
Chart #3 is a monthly chart of Gold (in the upper half) and the GC:GVZ ratio (depicted in histogram format in the lower half).
The major price resistance and support levels are 1350 and 1250, respectively.
Corresponding to those are the major ratio resistance and support levels of 80.00 and 60.00, respectively. In this regard, it will be important for the ratio to remain above 60.00 and the ratio 5 MA to remain above the 8 MA to confirm an upward bias on Gold on this timeframe.
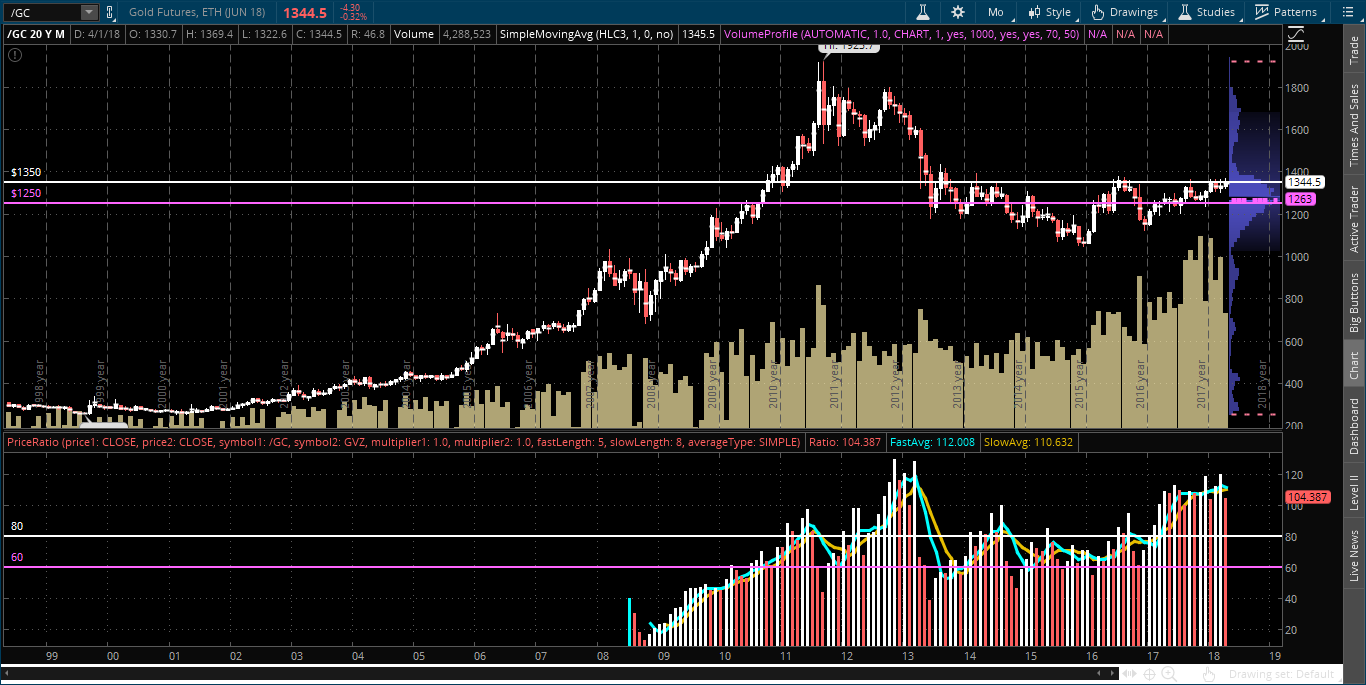
Chart #3
Chart #4 shows this ratio in candle format on a daily timeframe.
In the short term, watch for it to break and hold above its 50 & 200 MAs, for the RSI to pop and hold above 50.00, and for the MACD and PMO to form bullish crossovers in order to confirm such upward bias.


No Comments