• Entertainment
  • Finance
  • Marketing
  • Real Estate
  • Technology
  • Social
National Journal Community Of e-Experts
Finance

Study: The Stock Market Is Forming A Bullish Divergence

By Kurt Osterberg · On April 12, 2018

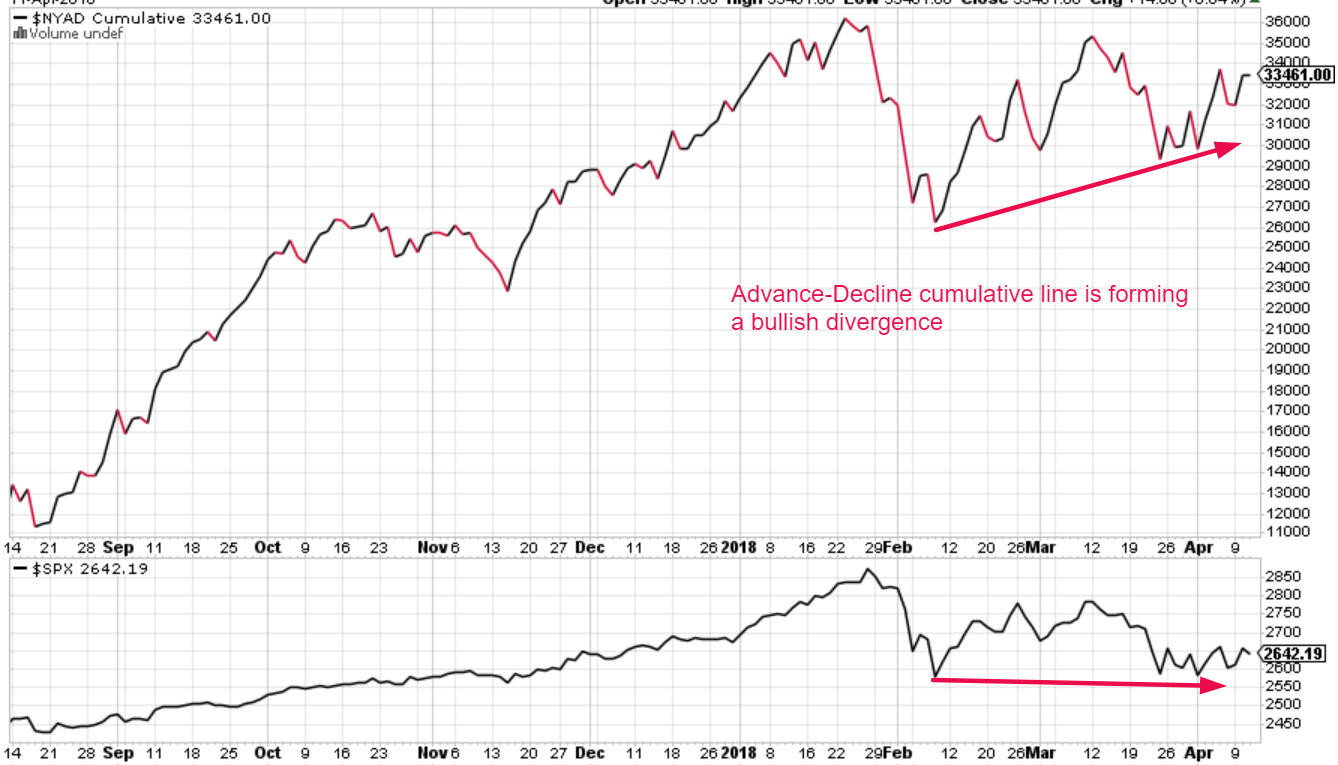
We mentioned before that the stock market is forming a bullish breadth divergence. You can clearly see this with the Advance-Decline cumulative line, which is making “lower highs” even though the S&P 500 is close to retesting its February 9, 2018 lows.

Hayes Martin from MarketExtremes.com found 8 similar cases since 1950 in which the S&P 500 formed a bullish divergence such as this in momentum and breadth indicators. Here are those historical cases, and here’s what happened next to the U.S. stock market.

  • February 11, 2016
  • October 16, 2014
  • October 3, 2011
  • March 9, 2009
  • October 11, 1990
  • December 4, 1987
  • December 6, 1974
  • October 7, 1966
  • Here’s what happened next to the S&P 500
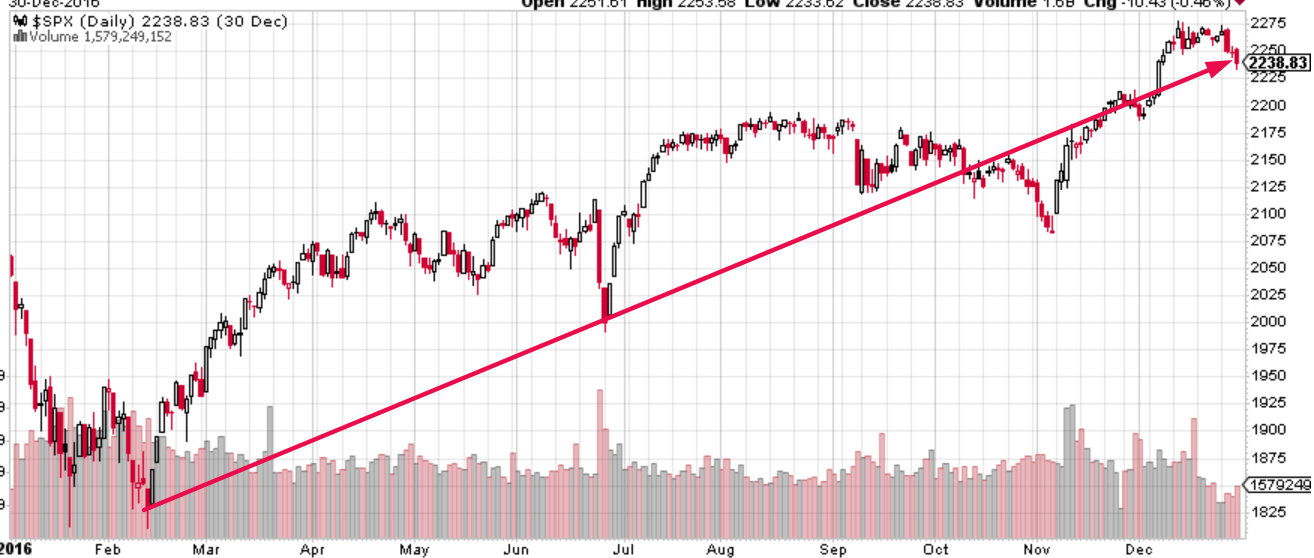
    February 11, 2016

    This bullish divergence happened at the exact bottom of the S&P 500’s 15.2% “significant correction”. The U.S. stock market soared throughout the rest of 2016 and 2017.
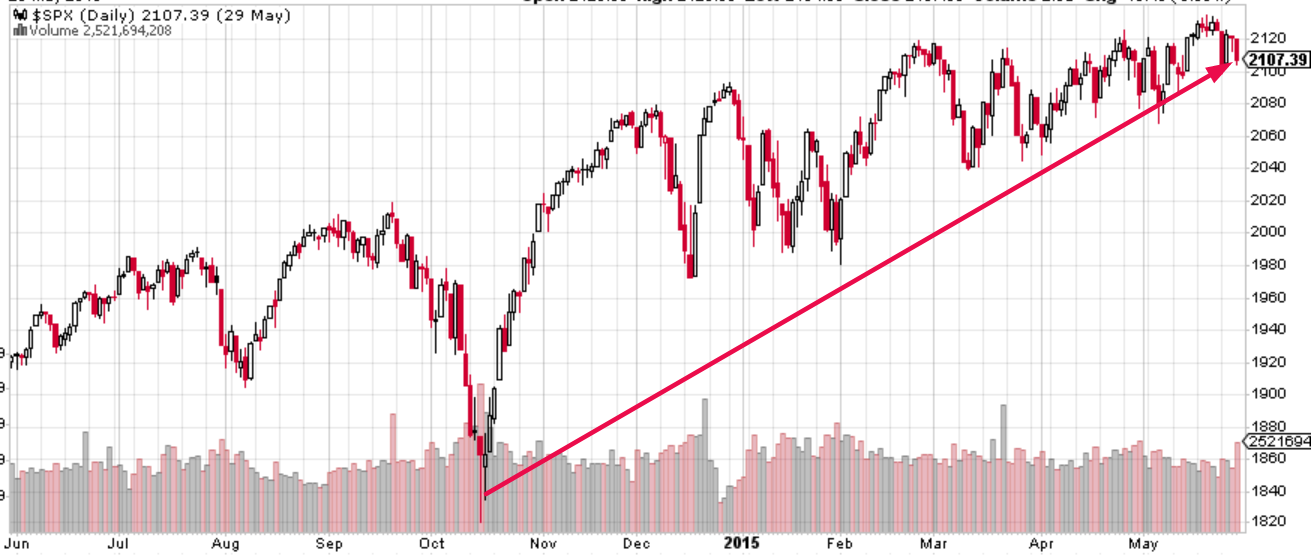
    October 16, 2014

    This bullish divergence happened 1 day after the S&P 500 ended its 9.8% “small correction”. The S&P’s next “significant correction” started 7 months later.
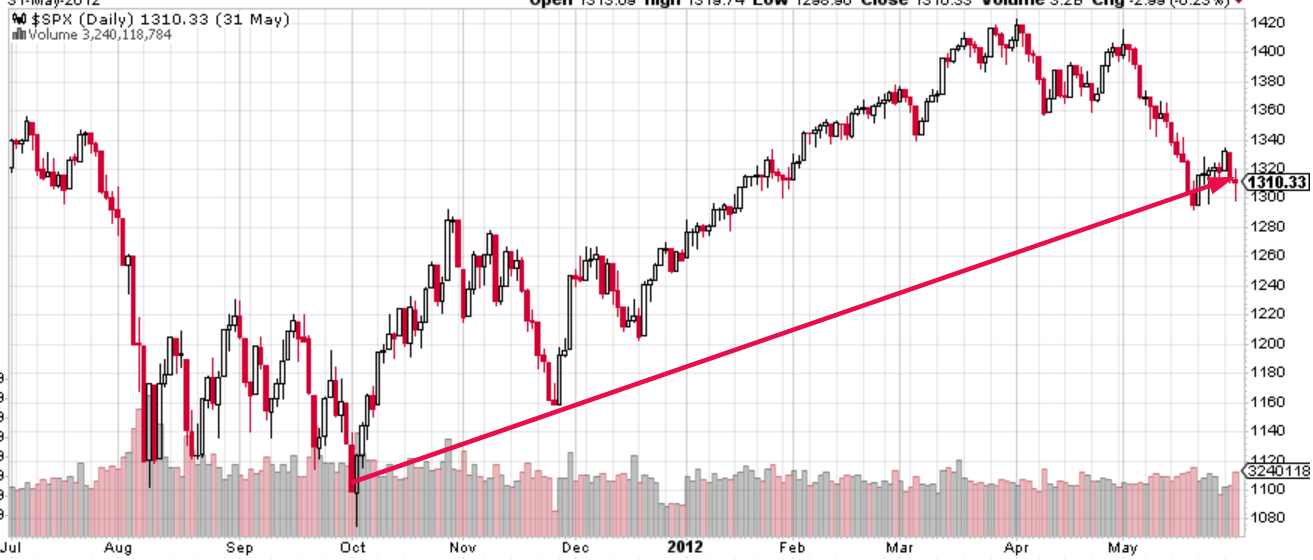
    October 3, 2011

    This bullish divergence occurred one day before the S&P completed its 21.5% “significant correction”. Then it promptly started to rally upwards in a very volatile manner.
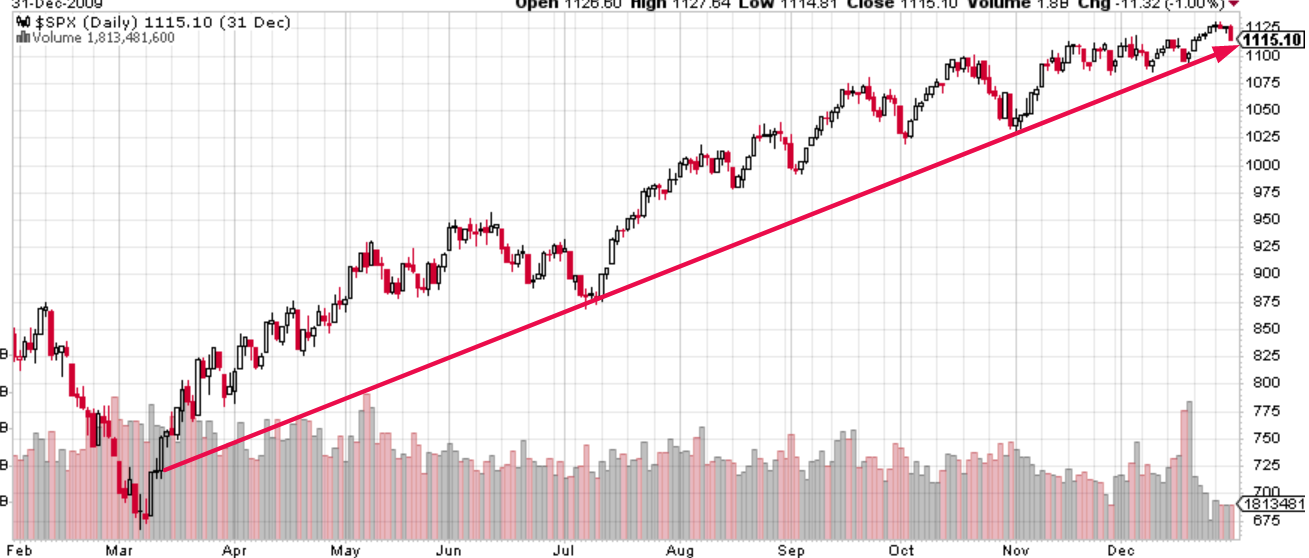
    March 9, 2009

    This occurred a few days after the 2007-2009 bear market ended. The S&P 500 soared throughout the rest of 2009.

    This historical case does not apply to today because we are not at the bottom of a bear market or recession.
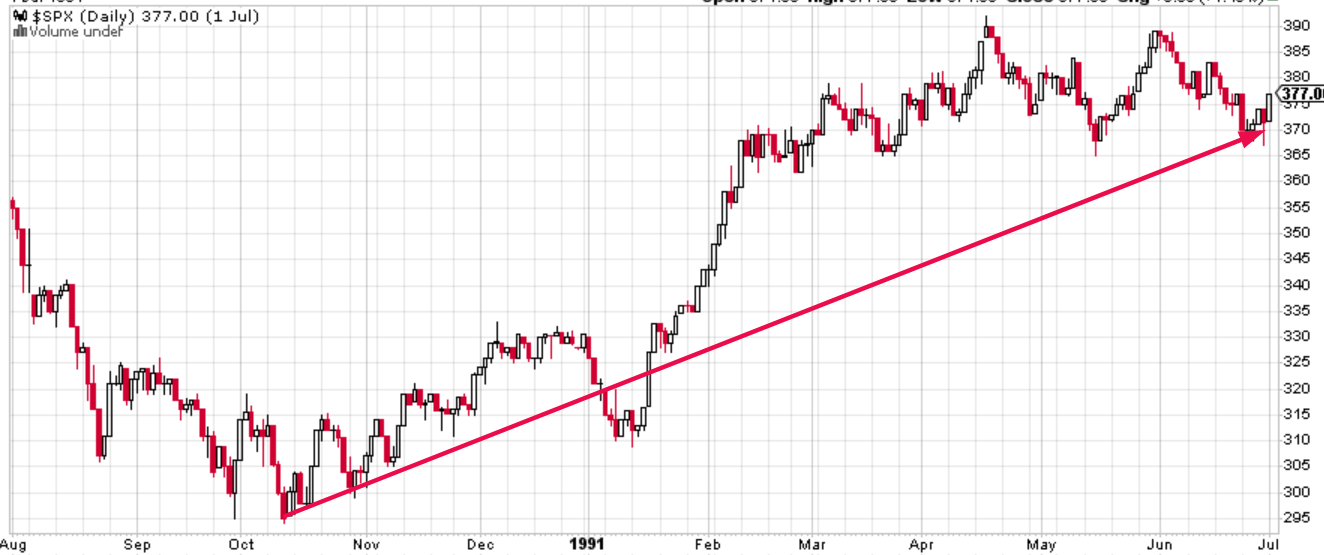
    October 11, 1990

    This bullish divergence happened at the exact bottom of the S&P 500’s 20.3% “significant correction”. The S&P soared throughout the rest of 1990-1991.

    December 4, 1987

    This bullish divergence happened during the retest wave for the October 1987 crash. This marked the exact bottom of the retest wave. The S&P 500 rallied from 1987-1990.

    Print Friendly, PDF & Email

    Share Tweet

    Kurt Osterberg

    You Might Also Like

    • Finance

      How To Earn A 10% Yield On Cost From PepsiCo Dividends

    • Finance

      Extreme Cold Weather Forecast Puts Natural Gas ETFs In Focus

    • Finance

      How To Trade Options

    Top Finance

    • Samsung Galaxy Note 9 Review Samsung Galaxy Note 9 Review
    • Dollar General (DG) Q2 Earnings And Revenues Surpass Estimates Dollar General (DG) Q2 Earnings And Revenues Surpass Estimates
    • Hey, Sand Hill Exchange. Shouting 'blockchain!' won't stop the Feds Hey, Sand Hill Exchange. Shouting ‘blockchain!’ won’t stop the Feds
    • Nike's Kaepernick Ad Has Cost The Company Over $3 Billion So Far Nike’s Kaepernick Ad Has Cost The Company Over $3 Billion So Far
    • Chart: Amazon’s Dominance In Ecommerce Chart: Amazon’s Dominance In Ecommerce

    New Posts

    • How To Earn A 10% Yield On Cost From PepsiCo Dividends

      How To Earn A 10% Yield On Cost From PepsiCo Dividends

      October 21, 2018
    • Extreme Cold Weather Forecast Puts Natural Gas ETFs In Focus

      Extreme Cold Weather Forecast Puts Natural Gas ETFs In Focus

      October 21, 2018
    • How To Trade Options

      How To Trade Options

      October 21, 2018
    • Adding To Merkel’s Woes: SPD’s Collapse In Germany, Greens The New Left Darlings

      Adding To Merkel’s Woes: SPD’s Collapse In Germany, Greens The New Left Darlings

      October 20, 2018
    • Self Sufficiency Over Adversity

      Self Sufficiency Over Adversity

      October 20, 2018
    • About
    • Contact Us
    • Privacy & Policy
    • Sitemap
    • Terms of use

    Copyright © 2018 NJCEE. All Rights Reserved.