• Entertainment
  • Finance
  • Marketing
  • Real Estate
  • Technology
  • Social
National Journal Community Of e-Experts
Finance 0

Weekly Unemployment Claims: Down 1K, Slightly Worse Than Forecast

By Kurt Osterberg · On April 19, 2018

Here is the opening statement from the Department of Labor:

In the week ending April 14, the advance figure for seasonally adjusted initial claims was 232,000, a decrease of 1,000 from the previous week’s unrevised level of 233,000. The 4-week moving average was 231,250, an increase of 1,250 from the previous week’s unrevised average of 230,000.

Claims taking procedures in Puerto Rico and in the Virgin Islands have still not returned to normal. [See full report]

This morning’s seasonally adjusted 2323K new claims, down 1K from the previous week’s figure, was slightly above the Investing.com forecast of 230K.

Here is a close look at the data over the decade (with a callout for the past year), which gives a clearer sense of the overall trend in relation to the last recession.

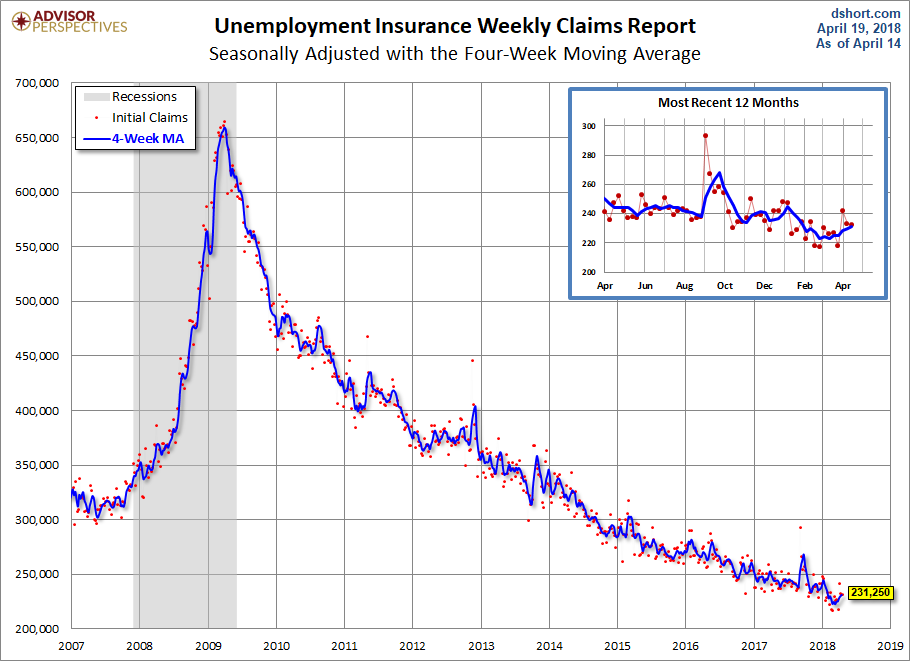
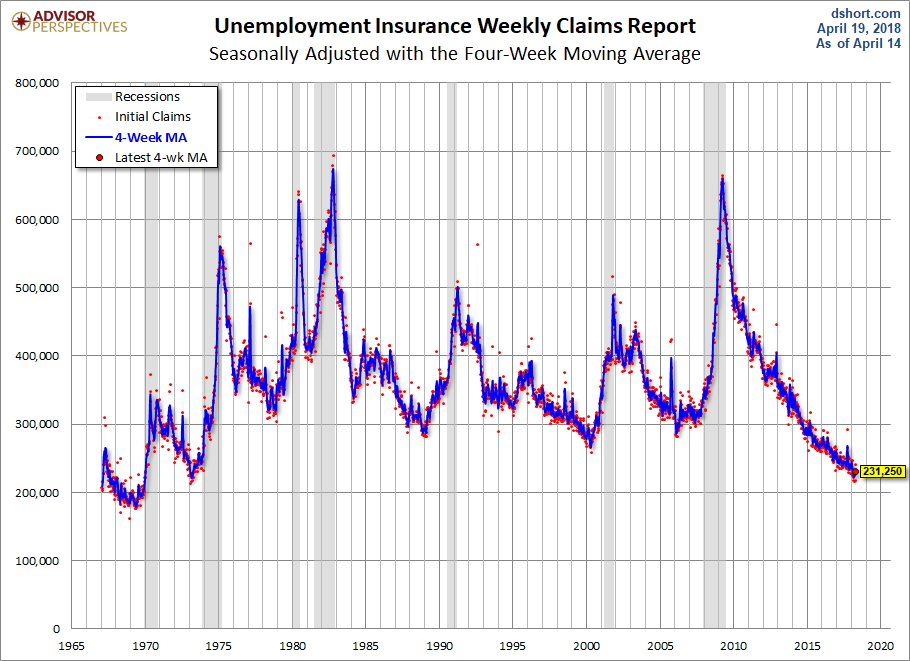
As we can see, there’s a good bit of volatility in this indicator, which is why the 4-week moving average (the highlighted number) is a more useful number than the weekly data. Here is the complete data series.

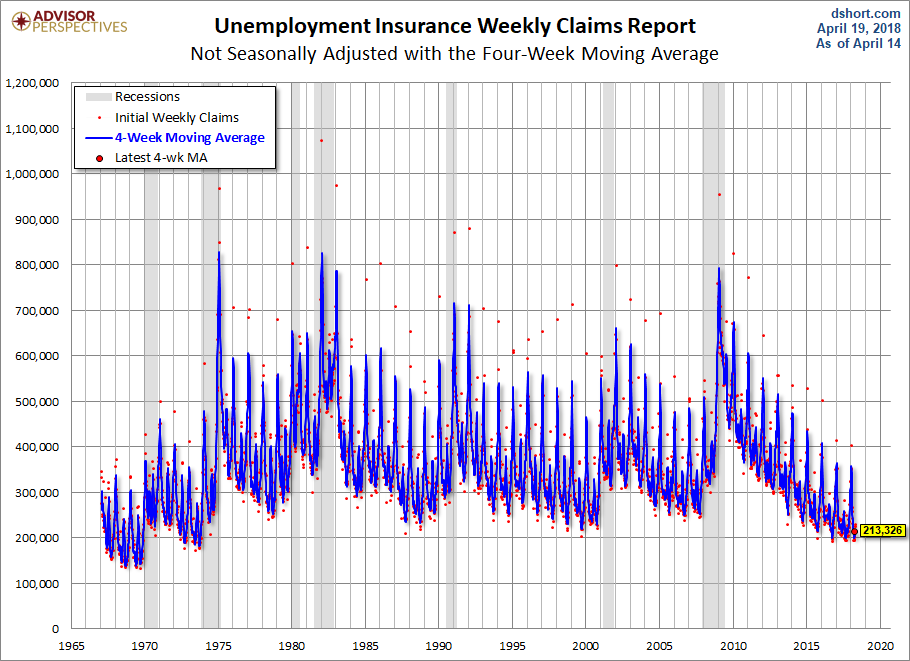
The headline Unemployment Insurance data is seasonally adjusted. What does the non-seasonally adjusted data look like? See the chart below, which clearly shows the extreme volatility of the non-adjusted data (the red dots). The 4-week MA gives an indication of the recurring pattern of seasonal change (note, for example, those regular January spikes).

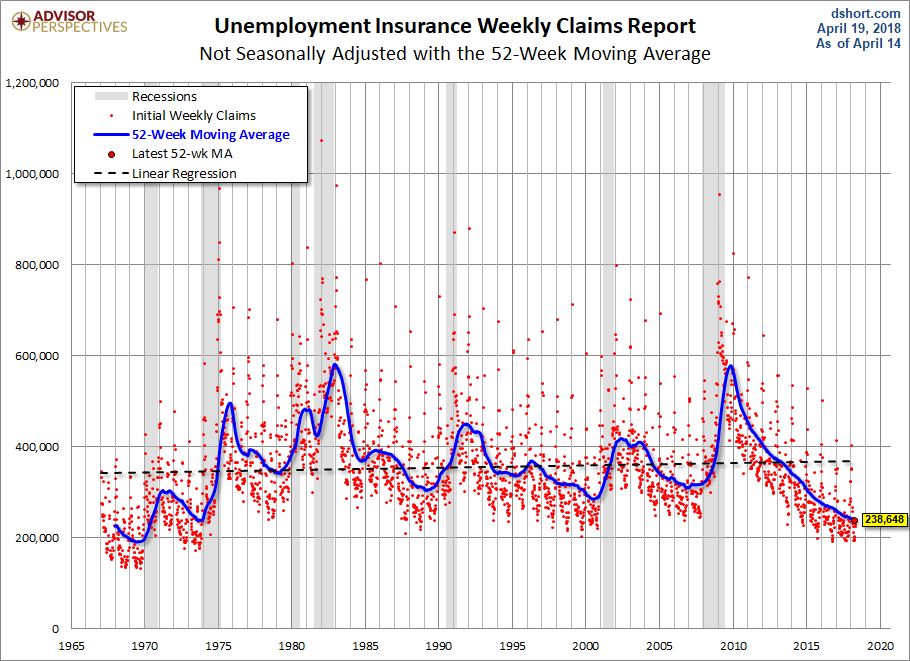
Because of the extreme volatility of the non-adjusted weekly data, we can add a 52-week moving average to give a better sense of the secular trends. The chart below also has a linear regression through the data. We can see that this metric continues to fall below the long-term trend stretching back to 1968.

Annual Comparisons

Here is a calendar-year overlay since 2009 using the 4-week moving average. The purpose is to compare the annual slopes since the peak in the spring of 2009, near the end of the Great Recession.

Print Friendly, PDF & Email

Share Tweet

Kurt Osterberg

You Might Also Like

  • Finance

    STEPN Sneaker NFTs Sell For $100, Previously Worth $1200

  • Finance

    NFT Prices in Free Fall – 5 NFT Collections to Start Buying Today

  • Finance

    5 NFTs Trending on Twitter Going Cheap to Invest in Now

No Comments

Leave a reply Cancel reply

Top Finance

  • 3 Best Large-Cap Blend Mutual Funds For Enticing Returns 3 Best Large-Cap Blend Mutual Funds For Enticing Returns
  • What is Value Chain Analysis? How to Deliver Value & Gain a Competitive Advantage What is Value Chain Analysis? How to Deliver Value & Gain a Competitive Advantage
  • Hedge Funds In The US Hedge Funds In The US
  • 5 Ridiculously Useful Non-Monetary Reward Examples that Improve Employee Engagement 5 Ridiculously Useful Non-Monetary Reward Examples that Improve Employee Engagement
  • Chart: Amazon’s Dominance In Ecommerce Chart: Amazon’s Dominance In Ecommerce

New Posts

  • STEPN Sneaker NFTs Sell For $100, Previously Worth $1200

    STEPN Sneaker NFTs Sell For $100, Previously Worth $1200

    June 20, 2022
  • NFT Prices in Free Fall – 5 NFT Collections to Start Buying Today

    NFT Prices in Free Fall – 5 NFT Collections to Start Buying Today

    June 20, 2022
  • 5 NFTs Trending on Twitter Going Cheap to Invest in Now

    5 NFTs Trending on Twitter Going Cheap to Invest in Now

    June 20, 2022
  • Bill Gates – ‘NFTs & Crypto Based on Greater Fool Theory’

    Bill Gates – ‘NFTs & Crypto Based on Greater Fool Theory’

    June 20, 2022
  • Actor Seth Green Pays $300,000 to Recover his Stolen BAYC NFT

    Actor Seth Green Pays $300,000 to Recover his Stolen BAYC NFT

    June 20, 2022
  • About
  • Contact Us
  • Privacy & Policy
  • Sitemap
  • Terms of use

Copyright © 2018-2021 NJCEE. All Rights Reserved.