AT40 = 55.8% of stocks are trading above their respective 40-day moving averages (DMAs)
AT200 = 46.3% of stocks are trading above their respective 200DMAs
VIX = 16.6
Short-term Trading Call: neutral
Commentary
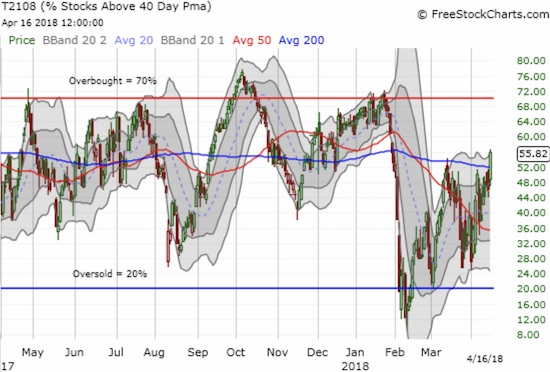
The buyers went right back to work after bears engulfed the end of trading last week.The indices crept higher on the day toward critical resistance at their 50-day moving averages (DMAs). Even more important to me was the performance of my favorite technical indicator, AT40 (T2108) aka the percentage of stocks trading above their respective 40DMAs. For the first time in 23 trading days, AT40 closed above 50%. AT40 is at its highest close since January 30th which means that once again it is on the edge of overcoming all the angst of the big sell-off that led to persistent oversold conditions in February. This breakout is unseen to most market participants, but I am sitting up straight and taking notes…
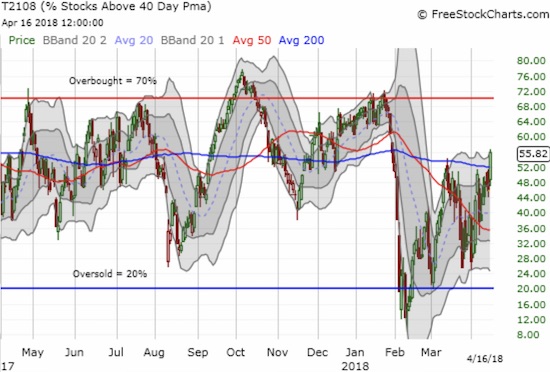
AT40 (T2108) broke out…and continued its pattern of higher highs and higher lows.
The S&P 500 (SPY) gained 0.8% after fading a bit from 50DMA resistance. The good news is that the index is actually managing an upward bias since its last test of 200DMA support. The Nasdaq gapped up right to 50DMA resistance on Friday. On Monday, the Nasdaq gapped up again but stopped cold again right under 50DMA resistance with a 0.7% gain. The price action for the PowerShares QQQ ETF (QQQ) was similar to the Nasdaq but a test of 50DMA resistance has yet to quite occur.
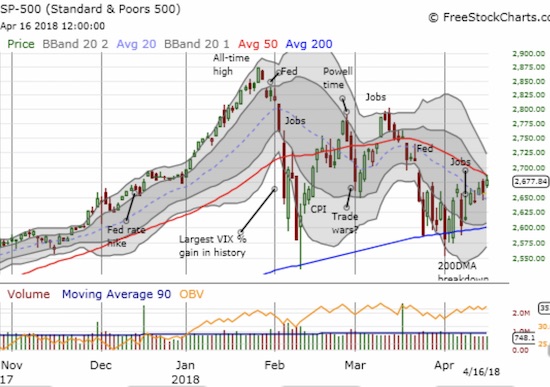
The S&P 500 (SPY) is facing down a critical test of 50DMA resistance.
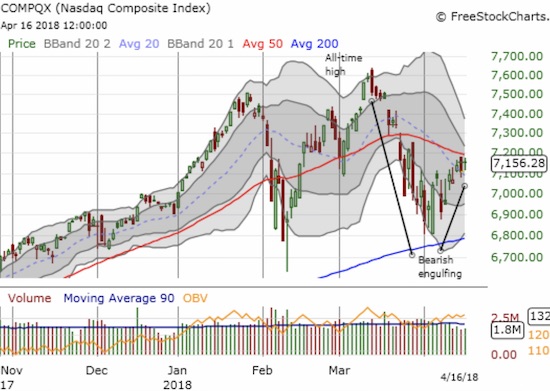
The Nasdaq is facing its own test of 50DMA resistance.
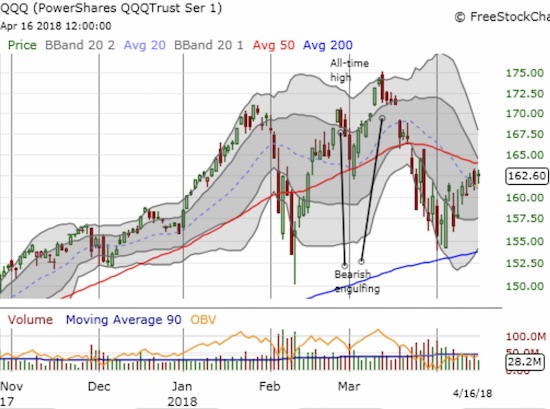
The PowerShares QQQ ETF (QQQ) is also trying to end the churn with an upward push toward 50DMA resistance.
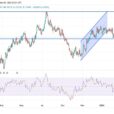
Given the upward bias growing in the major indices, I should not be surprised to see the volatility index, the VIX, continue to implode. Yet on Friday I locked in profits on my iPath S&P 500 VIX ST Futures ETN (VXX) short and bought call options on ProShares Ultra VIX Short-Term Futures (UVXY) in anticipation of more market chop along with a VIX rebound. The VIX rebound may still happen this week given it is well over-extended below its lower-Bollinger Band (BB). The chart below shows a cautionary tale of what happened when the VIX last extended this far below its lower-BB (in March)…







No Comments