• Entertainment
  • Finance
  • Marketing
  • Real Estate
  • Technology
  • Social
National Journal Community Of e-Experts
Finance 0

Chart Of The Week: China Property Outlook

By Kurt Osterberg · On March 5, 2018

This week the “Chart of the Week” is focused on the outlook for China’s property market. The Chinese property market is perhaps one of the most important markets in the world, if not the most. What happens to this market has direct flow-on effects to global commodity prices, emerging markets and commodity producers, and considerable influence on the cyclical macroeconomic and risk backdrop domestically.  

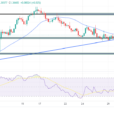
The chart comes from a report on the outlook for China’s economy (and the impact on the balance of risk vs opportunity for Copper prices). Basically the chart shows the average year-on-year price change across the largest 70-cities in China against our leading indicator. The key conclusion being that the Chinese property market is about to head into a slowdown.

The leading indicator incorporates interbank market interest rates, government bond yields, money supply growth, and property stock relative performance. Historically these factors have proven to offer a good lead on the outlook(and have helped me call tops and bottoms in this very cyclical market!), and the economic logic behind these factors is sound e.g. interest rates have a direct impact on financing costs.

In terms of the implications, it really depends on whether the outcome is a slowdown or a downturn. Given the lead-indicator has stabilized there is some hope that it will be just a slowdown (a downturn would be where property prices go into contraction, leading the property sector into recession). However the impact of a slowdown will still be felt across global markets, as it will impact on construction and raise downside risks for commodities.

Print Friendly, PDF & Email

Share Tweet

Kurt Osterberg

You Might Also Like

  • Finance

    Daily Market Outlook – Friday, Dec. 1

  • Finance

    FX Daily: Short-Term Rates Argue Against Another Big USD Leg Lower

  • Finance

    Elliott Wave Technical Analysis Day Chart: U.S. Dollar/Swiss Franc – Friday, Dec. 1

No Comments

Leave a reply Cancel reply

Top Finance

  • 3 Best Large-Cap Blend Mutual Funds For Enticing Returns
  • 5 Ridiculously Useful Non-Monetary Reward Examples that Improve Employee Engagement
  • What is Value Chain Analysis? How to Deliver Value & Gain a Competitive Advantage
  • Hedge Funds In The US
  • Chart: Amazon’s Dominance In Ecommerce

New Posts

  • Daily Market Outlook – Friday, Dec. 1

    Daily Market Outlook – Friday, Dec. 1

    December 1, 2023
  • FX Daily: Short-Term Rates Argue Against Another Big USD Leg Lower

    FX Daily: Short-Term Rates Argue Against Another Big USD Leg Lower

    December 1, 2023
  • Elliott Wave Technical Analysis Day Chart: U.S. Dollar/Swiss Franc – Friday, Dec. 1

    Elliott Wave Technical Analysis Day Chart: U.S. Dollar/Swiss Franc – Friday, Dec. 1

    December 1, 2023
  • Surprise Chicago PMI Read Shakes FX Market

    Surprise Chicago PMI Read Shakes FX Market

    December 1, 2023
  • 4 Hour Chart Elliott Wave Technical Analysis: USDCHF – Friday, December 1

    4 Hour Chart Elliott Wave Technical Analysis: USDCHF – Friday, December 1

    December 1, 2023
  • About
  • Contact Us
  • Privacy & Policy
  • Sitemap
  • Terms of use

Copyright © 2018-2021 NJCEE. All Rights Reserved.