
Once again, 10-year Treasury yields failed at the top end of a long-term channel, although can push higher near term, creating a trading opportunity in TLT.

Close, but no cigar!
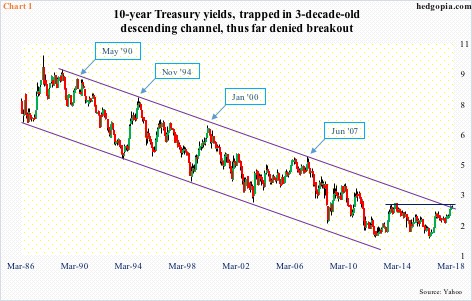
The 10-year rate came very close to breaking out of the three-decade-old descending channel it is in. Yields rose to 2.94 percent on February 21. Depending on how one draws the upper bound of the channel, the 10-year either faintly broke out or kissed the upper end before retreating (Chart 1).
Because it is a declining channel, a breakout will occur sooner or later. Bond vigilantes therefore are probably closely watching three percent. The last time this level was hit was in late 2013/early 2014. Nearly a month ago, another test occurred, and yields (2.85 percent) since have slightly come under pressure.
On both the weekly and monthly charts, there is room for the 10-year to continue lower.

The inability to break out comes amidst signs of growth deceleration.
As of last Friday, the Atlanta Fed’s GDPNow model was forecasting 1Q18 real GDP growth of 1.8 percent. Not too long ago, the model expected growth of north of three percent. This comes on the heels of growth of 2.5 percent in 4Q, 3.2 percent in 3Q17 and 3.1 percent in 2Q17.
Signs of deceleration are evident in several other data points. Take housing.
In January, sales of new homes dropped 7.8 percent month-over-month to a seasonally adjusted annual rate of 593,000 units, while that of existing homes fell 3.2 percent to 5.38 million (SAAR). Both reached cycle highs last November – 696,000 and 5.72 million, respectively. They were the highest since October and February 2007, in that order. (February’s numbers come out this week – existing on Friday and new on Wednesday.)
Chart 2 uses this data on a 12-month rolling average basis. The red line already seems to be in a process of rolling over, while the green line was flat in January with December.


No Comments