


Latest Posts
-
Finance 0

EUR/JPY Extends Rally Above 167.50 Following BoJ Rate Decision
Image Source: Unsplash EUR/JPY gains ground near 167.20 amid the weaker JPY on Friday. The BoJ kept interest rates steady around zero on Friday. ECB’s Nagel said he would be in favor of a rate cut in June. The EUR/JPY cross drifts higher to 167.20, its highest level since 2008, during the Asian trading hours on Friday. The uptick of the cross is supported by the weaker Japanese Yen (JPY) after the Bank of Japan (BoJ) announced its policy decision. The Bank of Japan (BoJ) board members decided to leave the key interest rate unchanged at 0% at its April policy meeting on Friday, as widely expected. The Japanese central bank hi... -
Finance 0
Gold Price Flatlines As Traders Look To US PCE Price Index For Some Meaningful Impetus
Image Source: Unsplash Gold price lacks any firm intraday direction and is influenced by a combination of diverging forces. The weaker US GDP print and a rise in US inflation benefit the metal amid subdued USD demand. Hawkish Fed expectations cap the upside as traders await the release of the US PCE Price Index. Gold price (XAU/USD) struggles to capitalize on the previous day’s modest gains and oscillates in a narrow range during the Asian session on Friday amid mixed fundamental cues. The US GDP report released on Thursday pointed to a significant loss of growth momentum at the start of 2024 and an unwelcome pickup in inflation. This,... -
Finance 0
Elliott Wave Technical Analysis – ChainLink Crypto Price News
Image Source: PexelsElliott Wave Analysis TradingLounge Daily Chart ChainLink/ U.S. dollar(LINKUSD) LINKUSD Elliott Wave Technical Analysis Function: Counter Trend Mode: Corrective Structure: Zigzag Position: Wave C Direction Next higher Degrees: Wave (I) of Impulse Wave Cancel invalid Level: 8.498 Details: the corrective of Wave (II) is equal to 61.8% of Wave (I) at 8.702 Log scale chartChainLink/ U.S. dollar(LINKUSD)Trading Strategy: The second wave correction is likely to go down to test the 10.585 level before rising again in the third wave. Therefore, the overall picture is a short-term pullback to continue rising. Wait for the correcti... -
Finance 0
The Bizarre Credit Suisse Banking Saga…And The Importance Of Bank Safety
Image Source: UnsplashA quite bizarre piece of news has recently hit the investor community which is not really being addressed by the financial media. I assume the reason that it’s not being covered by the financial media is because it deals with a complex issue involving bank regulators. But we will try to outline the issue regardless.According to the Financial Times, FINMA, which is the Swiss financial regulator, blocked the disclosure of key documents to the former holders of Credit Suisse’s AT1 notes who are suing FINMA for the write-down of CS’s AT1s. This directed write-down went outside the published order of prio... -
Finance 0
These 3 Companies Could Positively Surprise Investors
Image Source: PexelsEarnings season is always an exciting time for investors, with companies finally revealing what’s transpired behind closed doors.As usual, the big banks shifted the cycle into a much higher gear, with many other companies scheduled to follow suit.Concerning looming surprises, Arista Networks (ANET – Free Report), Coinbase (COIN – Free Report), and KB Home (KBH – Free Report) could all bring positivity, with each boasting a positive Earnings ESP Score. But how do expectations stack up heading into the releases? Let’s take a closer look.CoinbaseCoinbase, a current Zacks Rank #1 (Strong Buy), i... -
Finance 0
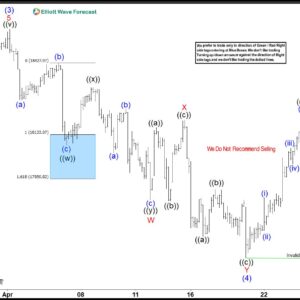
Elliott Wave Analysis Favors DAX To Extend Higher
Short Term Elliott Wave View on DAX suggests rally from 10.23.2023 low is unfolding as a 5 waves impulse. Up from 10.23.2023 low, wave (1) ended at 17003.28 and dips in wave (2) ended at 16345.02. The Index extended higher in wave (3) towards 18567.16 as the 1 hour chart below shows. Down from there, wave (4) unfolded as a double three Elliott Wave structure. Down from wave (3), wave ((w)) ended at 18088.03 and wave ((x)) ended at 18326.37. Wave ((y)) lower ended at 17864.69 which completed wave W in higher degree. Wave X rally ended at 18191.95 with internal subdivision as expanded flat.The Index then extended lower in wave Y towards 17621.... -
Finance 0
Markets Fight Back, Stay Red; MSFT, GOOGL, SNAP Beat On Late Earnings
Image Source: UnsplashMarkets took another tumble today out of the gate. The major indices fought back and closed near session highs, but still well-off breakeven. The Dow finished down -375 points, -0.98%, which was the worst of the bunch. Elsewhere, the S&P 500 dropped -0.46%, the Nasdaq was off -0.64%, and the small-cap Russell 2000 -0.76%. All four indices are still positive for the week, with one more day of trading to go.Early morning whiffs of “stagflation” from economic prints joined with disappointing early morning Q1 reports. This created a major downdraft in sentiment, even as it likely increased the Fed’s willingness to... -
Finance 0

SPDR ETF Report For Thursday, April 25
Image Source: PixabayIn this video, Ira Epstein reviews the day’s trading in various SPDR-ETF markets for the trading day that ended, Thursday, April 25.Video Length: 00:15:32More By This Author:Financial Markets Report For Thursday, April 25Metals Report For Tuesday, April 23Financial Markets Report For Tuesday, April 23... -
Finance 0
Scenario Analysis For Friday’s Trading Session
Image Source: PexelsThe S&P is currently in a range between 4950 and 5250. After blowout earnings from Google (GOOG/GOOG) and excellent earnings from Microsoft (MSFT) Thursday afternoon, the market is going to gap up at Friday’s open. The question is: What happens after that? I see three scenarios.The first scenario is a “gap and go”. The market gaps up at the open – and keeps melting up higher throughout the day. The level bulls want to see taken out – and bears want to see hold – is the 50 DMA at 5122 – about 75 points higher than Thursday’s close. In this first scenario, the S&P bursts through the 50 DMA, putting ... -
Finance 0

Asia Morning Bites For Friday, April 26
Image Source: PixabayGlobal markets and macro Global Markets: Sticky prices indicated in the first quarter GDP deflator and PCE price numbers yesterday have pushed US Treasury yields higher, even though the GDP figure was a lot softer than expected. 2Y yields rose 7.1 basis points to 4.998%, and 10Y yields rose 6.2bp to 4.704%, their highest since November 2023. EURUSD dropped sharply on the data but recovered all those losses and is sitting at just over 1.07 now, slightly higher than yesterday at the same time. The AUD followed a similar path and has also made gains overall, rising to 0.6524. Cable also rose, but the JPY remains soft at ...
- « Previous Page
- 1
- …
- 13
- 14
- 15
- 16
- 17
- …
- 4097
- Next Page »
Top Posts
-
 The Importance for Individuals to Use Sustainable Chemicals
-
 Small Businesses: Finding the Right Candidate for the Job
-
 How to Write the Perfect Thank You Letter After Your Job Interview
-
 3 Best Large-Cap Blend Mutual Funds For Enticing Returns
-
 China suspected in massive breach of federal personnel data
New Posts

Ripple Vs SEC Lawsuit Update: Here’s What To Expect Next Week
Louis Gave’s “Anti-Fragile Asset Of Choice”

April Recap: All 7 AI Category Portfolios Declined By 4%, On Average
Option Selling Has Become Consensus: Its Impacts
Solana And Ethereum Signal Uncertainty, While Investors Flock To Furrever Token: Is It Time To Invest FURR?