


Latest Posts
-
Finance 0
Simple Secrets Of January: Identify Trends & Tops
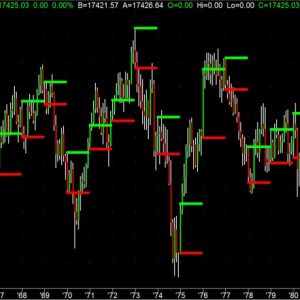
After a strong bull run from 2009 to 2017 it’s prudent to consider these two questions… #1. What if the market stalls out, and becomes range bound for 20 years? It’s happened before. Below you’ll find a monthly chart of such a period. #2. How can you stay with the current trend, without getting caught long at the inevitable market top? Nothing goes up forever. Range Bound Markets Happen After Big Bull Markets But They Don’t Have To End Trend Trades From 1963 to 1982 the Dow was range bound between 650 and 1000. This could be viewed as a nightmare for trend followers. However, even range bound markets can provide great s... -
Finance 0

2017 Sets A Record
In just the past year, the markets set a record by going 12 straight months without a loss. That liquidity driven surge was accompanied by extremely low volatility as noted last week by Dana Lyons: “Specifically, the average daily closing price of the VIX in 2017 was 11.10 (through 12/26/17). That is the lowest of any year — by more than one and a half points — since the VIX inception in 1986 (by comparison, the ‘average yearly average’ is over 20).” Of course, with very little volatility, there were very few draw downs along the way as markets continued their advance higher. “Accordingly, we took a look at the amount of... -
Finance 0

Japan ETFs Will Continue Their Stellar Run In 2018
As international investing delighted all and sundry in 2017, the Japanese stock market was on a stellar ride leading equities back to heights last seen in 1991. Both the Topix and the Nikkei climbed more than 19% for the year with the former capping the best annual performance since 2013. The rally was driven by a mix of Bank of Japan’s easy money policies and Prime Minister Shinzo Abe’s stimulus through “Abenomics” that are paying off, leading to strong growth and fat corporate profits. Japan is enjoying its longest stretch of economic growth since the 1990s, expanding for seven consecutive quarters. The robust growth is likely to co... -
Finance 0
EC Requiem For 2017: The Year In Charts
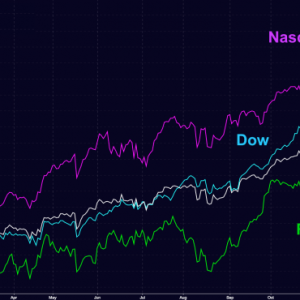
Here we are at the end of 2017, a year that saw Donald Trump ascend to the highest office in the land and a year that saw financial assets the world over continue to inflate on the back of trillions in central bank liquidity. This was also the year of the cryptocurrency and the year that left everyone asking about the “everything bubble.” In a tribute to what was all at once a boring year (no volatility) and the most exciting year in recent memory (from a geopolitical perspective), we thought we’d bring you a visual retrospective courtesy of the following series of charts. Enjoy. Or don’t. Whatever. U.S. stocks hit record after record... -
Finance 0

Dollar Thrashed Into Year End
In the last week of the year, the US dollar succumbed to broad selling pressure. Nearly all the major currencies appreciated by at least one percent against the dollar, save the Japanese yen, which gained about 0.6%. There did not seem to be a macro spark for the sell-off. Ironically, the consensus appears to be a mirror image of a year ago. At the end of 2016, with the prospect of populist winning European elections, and the promise of strong fiscal stimulus in the US, investors and speculators were bullish on the dollar.Now it seems that nearly everyone is bearish the dollar. Evidence that the synchronized global expansion is stre... -
Finance 0
E Large Cap Stocks: Gainers And Losers In 2017
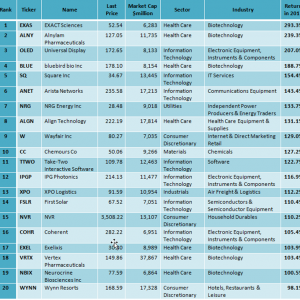
Investors in large cap stocks can be pretty satisfied with their returns in 2017. In fact, the Russell 1000 index, which represents about 1,000 of the largest companies in the U.S. stock markets, has appreciated 19.34% in 2017, besides approximately 1.73% in dividend yield. In this article, I will show the best and the worst performers among Russell 1000 stocks this year, and I will show 20 stocks that have a chance to perform well in 2018. Best Performers The table below presents the best 20 Russell 1000 performers in 2017, their market cap, sector and industry and the total return (price appreciation plus dividend yield) in 2017. It can be ... -
Finance 0
2017 Asset Class Total Return Performance
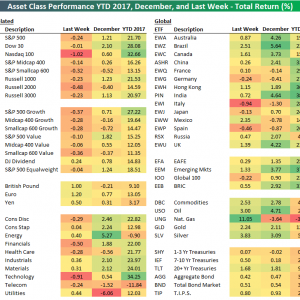
Below are the final total return numbers in 2017 for various asset classes using our key ETF matrix .Use our Trend Analyzer tool to monitor our proprietary Trend and Timing ratings for each of the ETFs shown (plus every stock in the S&P 500, Dow 30, and Nasdaq 100). While the Nasdaq 100 (QQQ) was the worst performing asset class in the final week of the year, it finished 2017 with a total return of 32.66%. That’s the biggest gainer of the US index ETFs we track. The S&P 500 Growth ETF (IVW) easily outperformed all other growth and value ETFs across large caps, mid caps, and small caps.From a sector perspective, Tech (XLK) gained... -
Finance 0
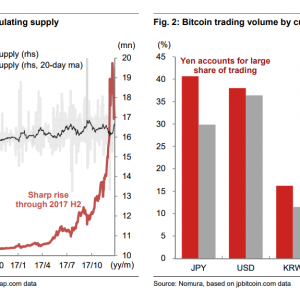
Bitcoin Effect On Japanese Economy “Cannot Be Ignored”, Says Nomura
Bitcoin’s price rise in 2017 has been stunning. For an asset linked to no tangible value, the increase in price from $998 on January 1 2017 to hitting a high of $19,497 on December 16 was more than just eye-popping. It created a tangible bitcoin effect on economic growth that, at least in Japan, translates into an impact on quarterly gross domestic product growth “that cannot be ignored,” according to a Nomura report. This is particularly true in Japan, where much of the bitcoin ownership is centered. Bitcoin effect: Second half of 2017, where most bitcoin gains occurred, primarily benefited Japanese citizens There is a “wealth effec... -
Finance 0
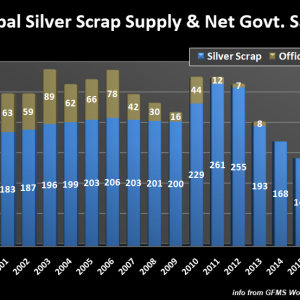
How The Investor Fundamentally Changed The Silver Market
While silver investors continue to be discouraged about the low price, the market has experienced a fundamental change that needs to be understood. Ever since governments removed silver from official coinage, over 50 years ago, the market has been supplemented by several billion ounces of silver. The majority of that supply has been depleted. The reason the United States and other countries stopped producing official silver coinage wasn’t due to any monetary conspiracy; rather it was based on a straightforward problem; supply versus demand. Because industrial silver consumption had skyrocketed after World War 2, the silver market would hav...
Top Posts
-
 The Importance for Individuals to Use Sustainable Chemicals
-
 Small Businesses: Finding the Right Candidate for the Job
-
 How to Write the Perfect Thank You Letter After Your Job Interview
-
 3 Best Large-Cap Blend Mutual Funds For Enticing Returns
-
 China suspected in massive breach of federal personnel data
New Posts

Crypto Momentum Fading – Are Buy The Dip Opportunities Underway?
Big Picture Technical Update For The Nasdaq 100 – Sunday, April 28
Is It Time To Double Down On Precious Metals And Mining Stocks?

Pharma Stock Roundup: Merck, Sanofi, AstraZeneca, Novartis’ Q1 Results, Pipeline & Regulatory Updates

Gold Falters, Treads Water