Latest Posts
-
Finance 0

The Commodities Feed: Central Banks Increase Gold Reserves
The latest data from the World Gold Council shows that central banks purchased around 800 tonnes of gold over the first three quarters of 2023 as geopolitical uncertainty pushed them to diversify more towards safety assets. The trend is likely to continue in the fourth quarter amid tensions in the Middle East. Energy – US oil inventory increased over last weekThe crude oil front-month contract has been trading soft at around US$85.7/bbl this morning as the risk premium continues to soften in the absence of any immediate danger to the oil supply from the Middle East. Oil supply remains healthy with a Reuters survey reporting that OPEC oil ... -
Finance 0
Japanese Fireworks Continue As The Market Turns To The FOMC
The FOMC meeting is today’s highlight but the drama in Japan continues to rivet the market. The Ministry of Finance warned of the risk of material intervention in the foreign exchange market, and the BOJ bought bonds in an unscheduled operation a day after its downgraded the 1.0% cap to a reference rate, whatever that means. The yen is trading with a slightly firmer bias. The Swiss franc is also trading a little firmer, but the other G10 currencies are a bit softer. Most emerging market currencies are lower too. Gold, which posted a bearish outside down day yesterday, extended its losses to about $1975 before stabilizing. Japan’s... -
Finance 0

SPDR ETF Report For Tuesday, October 31
Image Source: PixabayIn this video, Ira Epstein reviews the day’s trading in various SPDR-ETF markets for the trading day just ended, Tuesday, October 31.Video Length: 00:11:08More By This Author:Financial Markets Report For Tuesday, October 31Metals Report For Tuesday, October 31SPDR ETF Report For Monday, October 30... -
Finance 0
GBPJPY Looking For Acceleration As Elliott Wave Nest
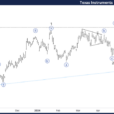
Image Source: PixabayThe short-term Elliott wave view in the GBPJPY suggests that the cycle from 03 October 2023 low is nesting higher & expected to accelerate higher. Up from there, the rally to 183.81 high ended wave 1 & then made a pullback in wave 2. The internals of that pullback unfolded as Elliott wave flat correction. Whereas the first leg of the flat ended in wave ((a)) at 180.93 low. Wave ((b)) bounce ended at 183.75 high and wave ((c)) completed at 180.73 low thus completed the wave 2 pullback.From there, the pair made a rally higher in an impulse sequence & showed a higher high sequence supporting the nest in wave... -
Finance 0
Top-Rated Stocks To Buy From A Variety Of Sectors After Earnings
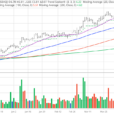
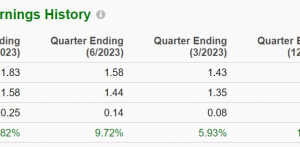
There are a number of top-rated Zacks stocks standing out from a variety of sectors as investors eye Wednesday’s Federal Open Market Committee (FOMC) meeting.With most eyes on the direction of monetary policy, here is a look at a few companies that may be ahead of the curve after beating earnings expectations on Monday.A Promising Cloud Services GiantAmong tech stocks cloud networking solutions provider Arista Networks (ANET) had a standout third quarter and easily surpassed top and bottom-line expectations.Arista’s stock popped +14% today after Q3 earnings of $1.83 per share beat the Zacks Consensus of $1.58 a share by 16%. More impres... -
Finance 0
EUR/USD Price Analysis: Hovers Above The 1.0550 Key Level Ahead Of Fed Decision
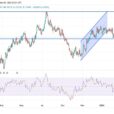
Image Source: Pixabay EUR/USD could revisit the previous week’s low at 1.0521 due to facing pressure. Any dovish remarks post-Fed decision could uplift the pair toward a 23.6% Fibonacci retracement level at 1.0648. RSI indicates a bias towards a weaker market sentiment. EUR/USD consolidates ahead of the Federal Open Market Committee (FOMC) policy decision with the expectation of maintaining the current interest rate at 5.5% in November’s meeting. The pair trades lower near 1.0570 during the Asian session on Wednesday.The Eurozone Harmonised Index of Consumer Prices (HICP) exhibited a significant slowdown in a report released on Tues... -
Finance 0
One-Sixth Remains
Image Source: UnsplashWith the first ten months of the year now out of the way, a mere one-sixth of 2023 remains. Considering how absolutely insane this year has been already in all arenas (financial, geopolitical, legal, you name it), one can only tremble to consider what the next two months might hold.Rather than dare speculate on the dozens of weighty matters already vexing the globe, I will simply focus on an octet of cash index charts along a common theme: the notion that each of them has hammered out a formidable and well-formed topping pattern and that, preposterous as it might seem to the mainstream pundits (and flying in t... -
Finance 0
Gold Still In Position For Breakout By End Of Year
Image Source: UnsplashGold closed October at $1994, failing to close above monthly resistance at $2000.Monthly and quarterly resistance remains at $2000, while yearly resistance remains at $1900. Should Gold close at $2010 or higher on December 31 then it will make a new yearly, quarterly, and monthly high.Video Length: 00:05:21More By This Author:Can Gold Make Monthly And Weekly All Time Highs?Gold Move Just Getting StartedKey Levels In Gold Into November... -
Finance 0

Financial Markets Report For Tuesday, October 31
Image source: PixabayIn this video, Ira Epstein reviews the activity in the Financial Markets after the day that just ended, Tuesday, October 31.Video Length: 00:09:53More By This Author:Metals Report For Tuesday, October 31SPDR ETF Report For Monday, October 30 Financial Markets Report For Monday, October 30... -
Finance 0
Elliott Wave Technical Analysis: BTCUSD – Wednesday, Nov. 1
Elliott Wave Analysis TradingLounge Daily Chart, 1 November 23, Bitcoin/U.S. dollar(BTCUSD) BTCUSD Elliott Wave Technical Analysis Function: Follow Trend Mode: Motive Structure: Impulse Position: Wave((3)) Direction Next higher Degrees: wave I of Impulse Wave Cancel invalid level: Details: Impulse’s five-wave rise. Bitcoin/U.S. dollar(BTCUSD)Trading Strategy: The increase continues the Impulse pattern. We are now in wave 3 position and we are still missing two more moves which would cause The price has a chance to rise above 37380.60. Bitcoin/U.S. dollar(BTCUSD)Technical Indicators: The price is above the MA200 indicating an uptrend, RS...
Top Posts
-
 The Importance for Individuals to Use Sustainable Chemicals
-
 Small Businesses: Finding the Right Candidate for the Job
-
 How to Write the Perfect Thank You Letter After Your Job Interview
-
 3 Best Large-Cap Blend Mutual Funds For Enticing Returns
-
 China suspected in massive breach of federal personnel data