• Entertainment
  • Finance
  • Marketing
  • Real Estate
  • Technology
  • Social
National Journal Community Of e-Experts
Finance 0

E Are Stocks Set Up To Bounce?

By Kurt Osterberg · On April 9, 2018

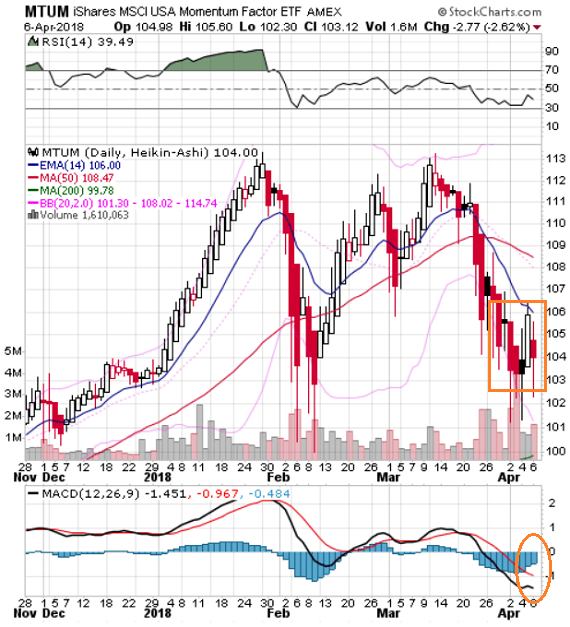
A standard chart that we use to help confirm the overall market trend is the Momentum Factor ETF (MTUM) chart. Momentum Factor ETF is an investment that seeks to track the investment results of an index composed of U.S. large- and mid-capitalization stocks exhibiting relatively higher price momentum. This type of momentum fund is considered a reliable proxy for the overall stock market trend. We prefer to use the Heikin-Ashi format to display the Momentum Factor ETF. Heikin-Ashi candlestick charts are designed to filter out volatility in an effort to better capture the true trend. In the updated chart below the orange square highlights the MTUM consolidating into a trading range. It is reasonable to expect a recovery bounce out of the trading range after being extremely oversold and already the orange circle indicates downward momentum is dissipating

MTUM DailyChart 04082018

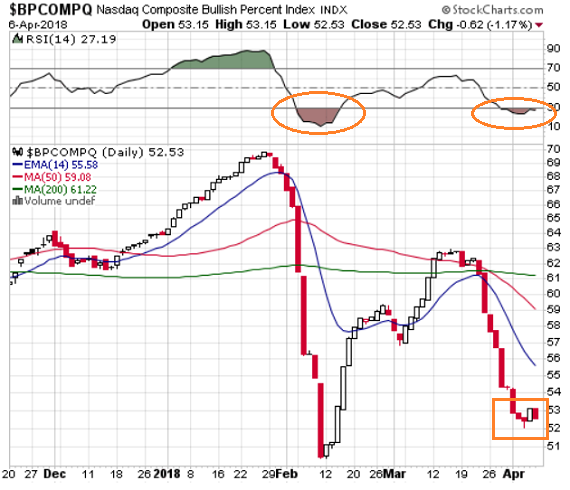
Another tool to help confirm the overall market trend is the Bullish Percent Index (BPI). The Bullish Index is a popular market “breadth” indicator used to gauge the internal strength/weakness of the market. Like many of the technical market internal indicators, it is used both to confirm a move in the market and as a non-confirmation and therefore divergence indication. We always point out how in recent years technology stocks have been a relatively reliable indicator of overall market direction. In the updated chart below, the orange circle denotes the current extremely oversold strength indicator where the Nasdaq usually stages a recovery bounce. Similar to the MTUM ETF above, the orange square in the $BPCOMPQ chart below shows the Nasdaq Index consolidating into a trading range. The next probable move is higher especially if upcoming quarterly earnings season produces favorable pronouncements.


BPCOMPQDailyChart 04082018


Print Friendly, PDF & Email

Share Tweet

Kurt Osterberg

You Might Also Like

  • Finance

    STEPN Sneaker NFTs Sell For $100, Previously Worth $1200

  • Finance

    NFT Prices in Free Fall – 5 NFT Collections to Start Buying Today

  • Finance

    5 NFTs Trending on Twitter Going Cheap to Invest in Now

No Comments

Leave a reply Cancel reply

Top Finance

  • 3 Best Large-Cap Blend Mutual Funds For Enticing Returns 3 Best Large-Cap Blend Mutual Funds For Enticing Returns
  • What is Value Chain Analysis? How to Deliver Value & Gain a Competitive Advantage What is Value Chain Analysis? How to Deliver Value & Gain a Competitive Advantage
  • Hedge Funds In The US Hedge Funds In The US
  • 5 Ridiculously Useful Non-Monetary Reward Examples that Improve Employee Engagement 5 Ridiculously Useful Non-Monetary Reward Examples that Improve Employee Engagement
  • Chart: Amazon’s Dominance In Ecommerce Chart: Amazon’s Dominance In Ecommerce

New Posts

  • STEPN Sneaker NFTs Sell For $100, Previously Worth $1200

    STEPN Sneaker NFTs Sell For $100, Previously Worth $1200

    June 20, 2022
  • NFT Prices in Free Fall – 5 NFT Collections to Start Buying Today

    NFT Prices in Free Fall – 5 NFT Collections to Start Buying Today

    June 20, 2022
  • 5 NFTs Trending on Twitter Going Cheap to Invest in Now

    5 NFTs Trending on Twitter Going Cheap to Invest in Now

    June 20, 2022
  • Bill Gates – ‘NFTs & Crypto Based on Greater Fool Theory’

    Bill Gates – ‘NFTs & Crypto Based on Greater Fool Theory’

    June 20, 2022
  • Actor Seth Green Pays $300,000 to Recover his Stolen BAYC NFT

    Actor Seth Green Pays $300,000 to Recover his Stolen BAYC NFT

    June 20, 2022
  • About
  • Contact Us
  • Privacy & Policy
  • Sitemap
  • Terms of use

Copyright © 2018-2021 NJCEE. All Rights Reserved.