

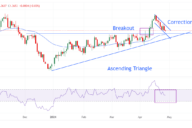
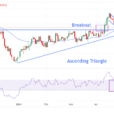
Everyone is hotly debating the charts formed by this year’s action. Is it a descending triangle with bearish implications? Or judging purely by the numbers, is it just one of those periodic cycles from low volatility to high, including a quick 10% correction.
Remember, everyone was losing their stuff over the fact that the market did not give us a 5% pullback all of last year. The last 10%-er was more than two years ago.
So, what is the current pattern? Or, more importantly, what does the market tell us about where it is likely to go once the 2018 roller-coaster calms down?
When the short-term is not so clear, or is more about volatility than trend, what do we do? We pull out to the larger view. Think of it as ignoring the noise to get a better handle on the big themes dominating the market.
I’m starting with the Dow Jones Industrial Average, even though it has its warts and other inconsistencies (such as how one stock can represent 20% of its move in any given day). Just take a look at this picture and quickly – I mean at first glance with no deep thought – what do you see?

OK, I did not give you a chance to form your own opinion but what I saw in the time it took to remove my finger from the “send” button on my keyboard was a bullish flag pattern.
You don’t agree? You think that spike down in early February negated it? Not me. Go ahead and draw a daily chart with closes only. Basically, we’re ignoring an intraday spike and nothing more.
What if I offered more evidence of a bullish-leaning pattern?
Not drawn is the trendline from the start of the latest bull run in February 2016. It’s still intact, although there was an intraday violation in early April.
And, of course, there is everyone’s favorite fair-weather friend, the 200-day average. It also still supports the current market.
The Standard & Poor’s 500 looks rather similar, as does the New York Stock Exchange Composite.


No Comments