
Most market participants have accepted that 2018 is unlikely to be another low-volatility year like 2017, but how do we translate the rising volatility into our market forecast? Some Wall Street bulls such as RBC’s Lori Calvasina have revised their year-end forecasts down recently.* Are those revisions because of the higher VIX?
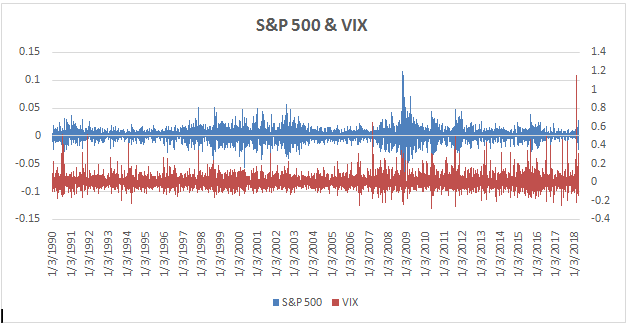
First, given that the VIX measures the implied volatility of the S&P 500, the negative correlation between the VIX and the S&P 500 is no surprise. Moreover, not only is the correlation significant, the co-movement between the daily changes of these two indexes is rather close. Metaphorically, if we consider these two indexes as if they were two sound waves, as shown in Figure 1, then both the timing and the intensity of the movements in the indexes make the VIX and the S&P 500 an equity market duet. (Data source: Bloomberg)

Figure 1. Co-movement between the S&P 500 and the VIX
Does a rising VIX signal lower equity returns? This may be a misconception among many investors. A rising VIX is usually accompanied by sequential negative market returns, the magnitude of which can be substantial, particularly during a rapidly increasing VIX environment. Therefore, we tend to associate lower returns with higher VIX. However, by definition, higher VIX is only a reflection of volatile movements in the market – it is not a predictor of future returns.
Nevertheless, the VIX is still powerful in terms of explaining market returns. If we assume that the relationship between the VIX and the S&P 500 is linear for the sake of simplicity, then we can capture a -1:0.1145 movement ratio between the VIX and the large-cap index. In another words, a roughly 9% increase in the VIX translates into a 1% drop in the S&P 500. But this oversimplification is not realistic, since we can see from Figure 2 that the distribution of the VIX is rather skewed compared to the S&P 500. Statistics 101 tells us that the relationship is not linear. Instead, if we look at the sunflower plot in Figure 3 (yes, sunflower plot is a scientific term), the relationship is also unlikely a complex curve; rather, the VIX is more subject to drastic movements than the S&P 500 is.


No Comments