
The US dollar appears to be carving a low against the yen. After a significant fall, investor ought to be sensitive to bottoming patterns.

The first tell was the key reversal on March 26. In this case, the key reversal was when the dollar made a new low for the move (~JPY104.55) and then rallied to close above the previous session high.
The second tell was the divergence with the technical indicators. The divergence is that the technical indicator did not confirm the dollar’s low. The 14-day RSI made a low on March 23, not following session when prices did.Indeed, the RSI made its low in the middle of February below 25. The MACDs also made its lowest in mid-February, and only experienced a shallow dip when the dollar recorded its lows.
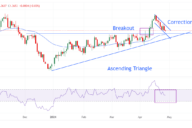
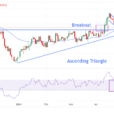
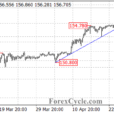
The third tell is taking place now, and that is what we are depicting in the Great Graphic we made on Bloomberg. The dollar appears to have traced a head and shoulders bottom pattern and is flirting with the neckline. The left shoulder was formed at the start of the month. The head was the two-session push below JPY105. The right shoulder was formed earlier this week on the pullback below JPY106. The neckline is found by connecting the rally after the left shoulder and head.It is found near JPY107.00. The measuring objective is found by rotating the pattern on the neckline.It projects to around JPY110.00.
We marked two other points on the chart. The first is a 200-day moving average, which is now found near JPY110.65. The other is the 61.8% retracement of the dollar’s decline beginning last November when it reached JPY114.75, and that is found near JPY110.85.The 50% retracement is found near JPY109.65.
The correlation between US Treasury yields and the dollar-yen exchange rate broke down. On a 60-day rolling, percent change basis, the correlation fell from 0.85 early last December to a low below 0.25 in mid-March. It is recovering now and is a little below 0.40. The 30-day rolling correlation is getting closer to 0.50 after a brief inversion in early February.


No Comments