

Tariff News Driving The S&P 500
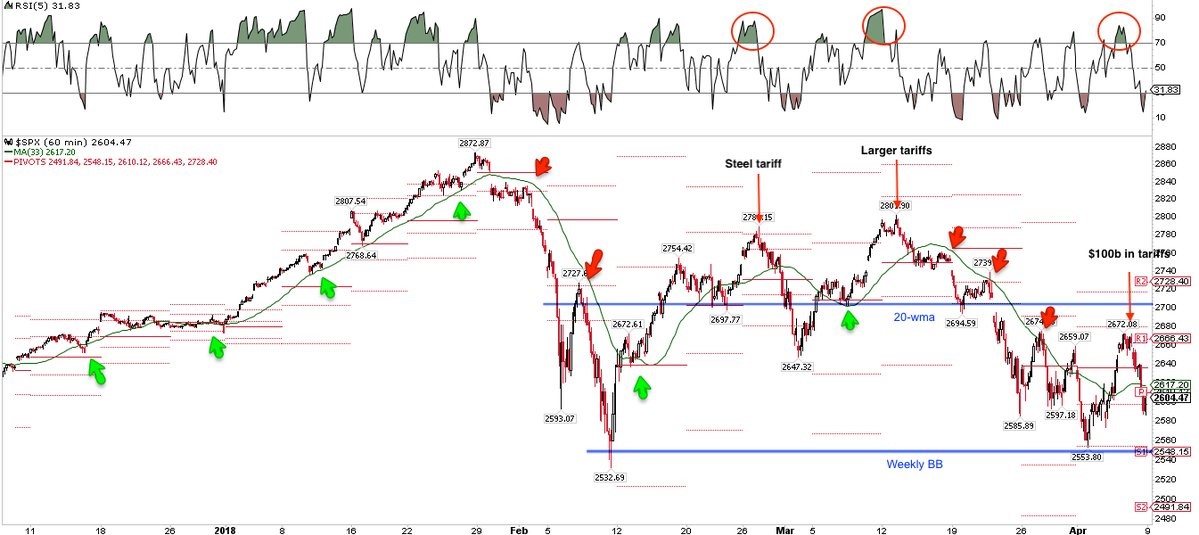
The chart below shows the S&P 500 since December. The tariff announcements are labeled along with the 33 day moving average and pivot points. The relative strength index is in the top chart. This correction has been longer than the average one. Judging based on the action before the steel tariffs were announced, it looks like the correction could’ve ended in early March if this trade scuffle never happened. The chart doesn’t show the latest rally on Tuesday in which stocks increased after President Xi’s speech which supported opening up the Chinese market to freer trade with lower tariffs. As you can see, sometimes stocks bounce off the moving average, while other times they ignored it. That’s what happens in a range bound market which doesn’t have a trend.
S&P 500 Breadth Indicators
The chart below shows the 200 day moving average. As you can see, the highlighted points show when the market fell below the 200 day moving average. They were the best buying opportunities of this bull market. This business cycle has been unique in that it has now had 4 slowing periods within the expansion. You could almost consider them recessions if the economy was growing at the rate it did in previous decades. However, this entire cycle has been relatively weak so they are clearly defined as slowdowns. An elongated growth cycle with many slowdowns is consistent with multiple periods where the S&P 500 falls below the 200 day moving average without the bull run ending.
The two charts below are breadth indicators. They are the percentage of stocks in the S&P 500 which are below their 50 day and 200 day moving average. The percentage of stocks below their 50 day moving average troughed in this correction close to the trough of previous corrections in this bull market. The percentage of firms below their 200 day moving average hasn’t reached levels seen in the previous correction. This might be because this correction has been centered around tech stocks and firms directly affected by the tariffs.


No Comments