

Last week we demonstrated a momentum+breadth study which supported the medium term bullish case for the stock market.
Now let’s look at the short term case for the stock market. Is the stock market’s EXACT bottom already in?
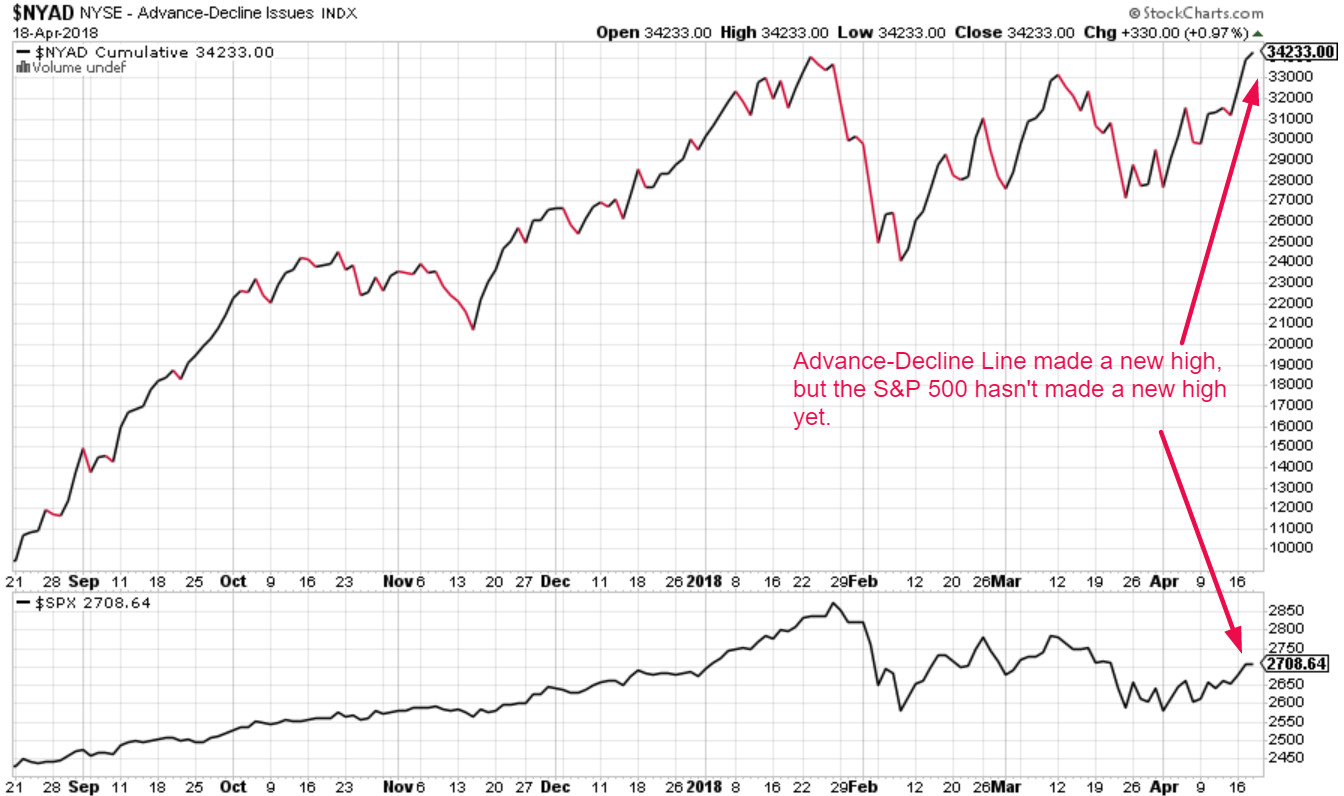
The NYSE cumulative Advance-Decline Line (one of the best breadth indicators) just made a new all-time high yesterday while the S&P 500 has yet to make a new high.
What happens historically when:
Is the S&P 500’s exact bottom already in? Here are the historical cases (based on correction start dates):
Let’s look at these historical cases in detail.
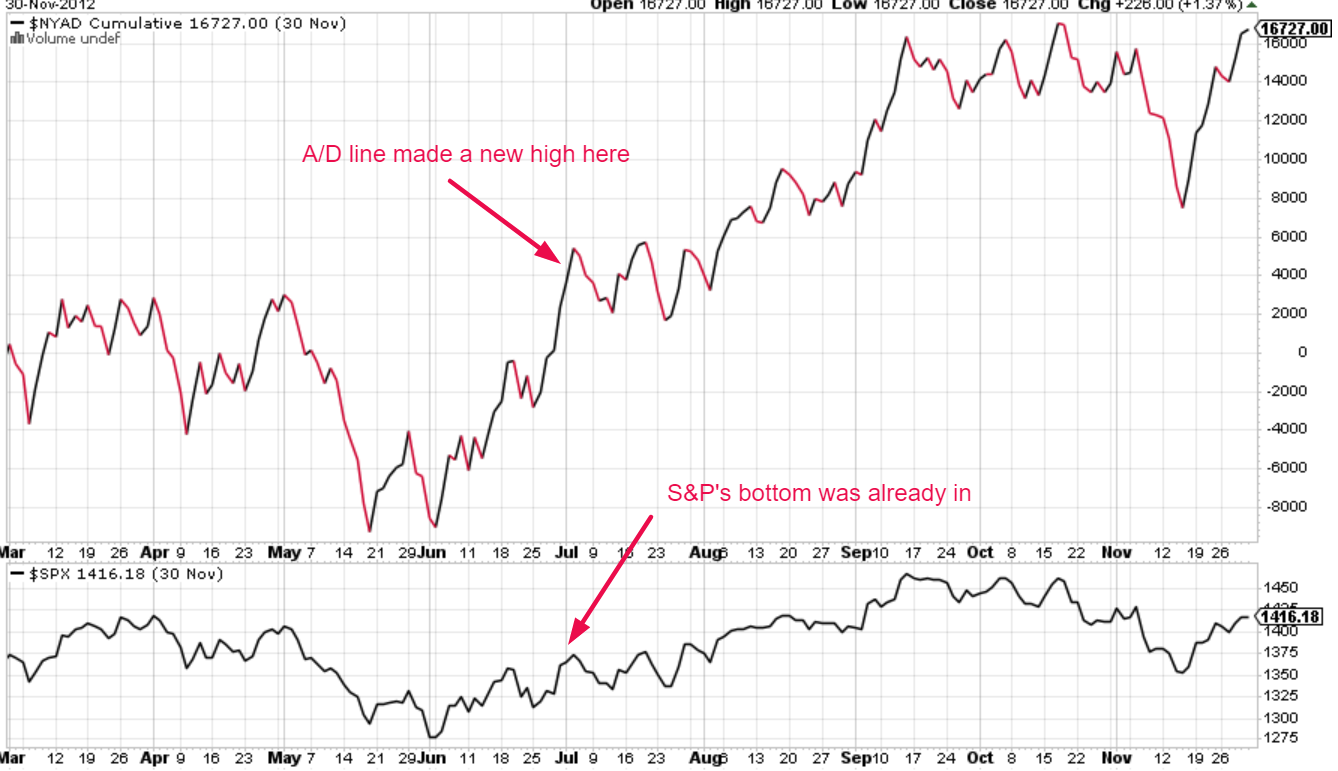
April 2, 2012
The Advance-Decline line made a new all-time high before the S&P did. The S&P did not make a lower low after the A/D line made new highs.
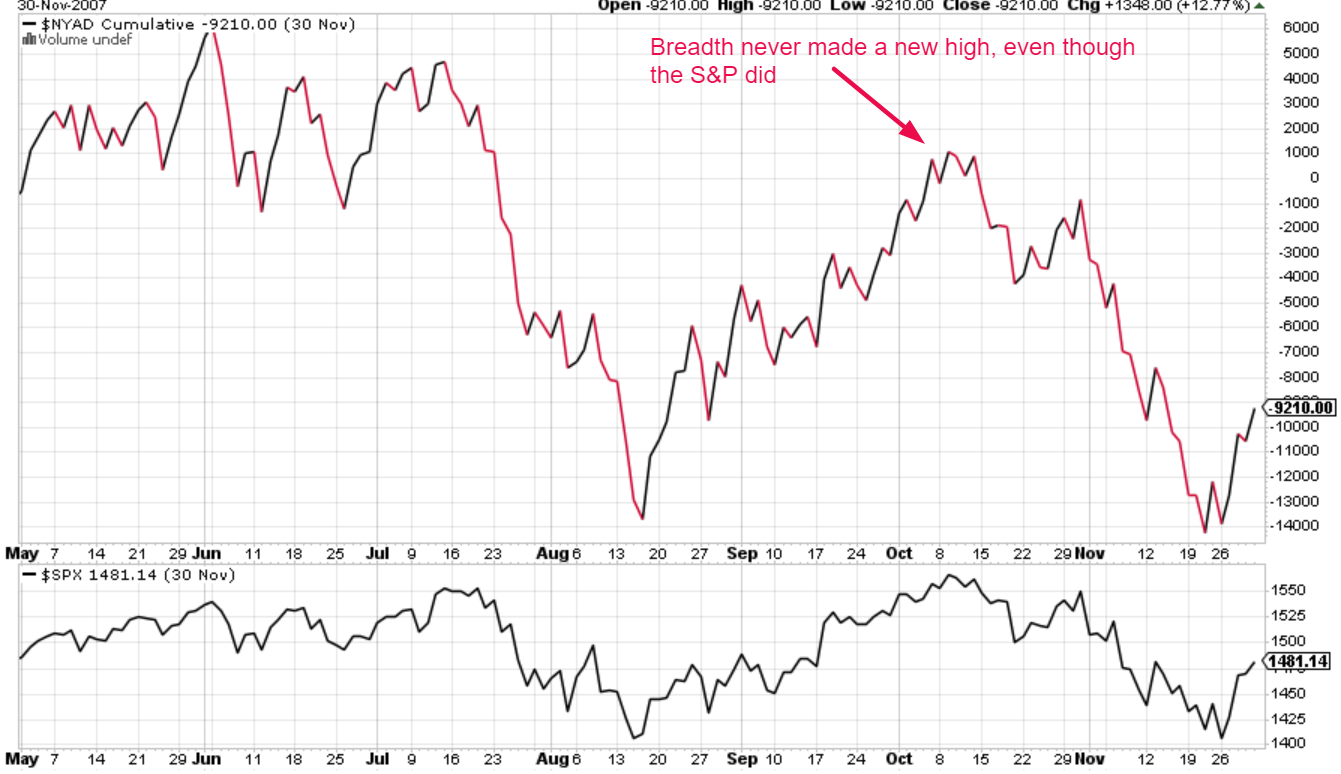
July 16, 2007
The S&P 500 made a new high before the A/D line did. The A/D line did not go on to make a new high.
This historical case does not apply to today because the A/D line has already made a new high.
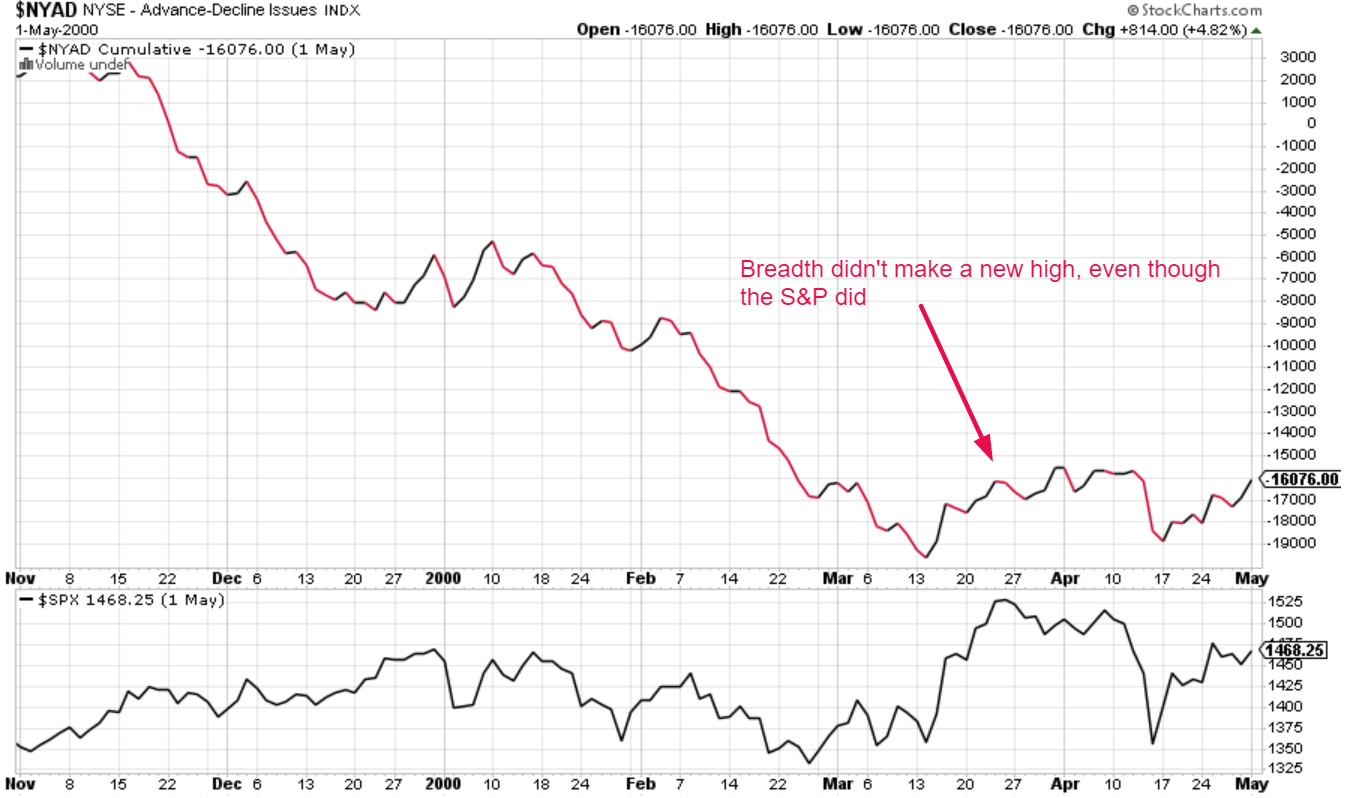
January 3, 2000
The S&P 500 made a new high before the A/D line did. The A/D line did not go on to make a new high.
This historical case does not apply to today because the A/D line has already made a new high.
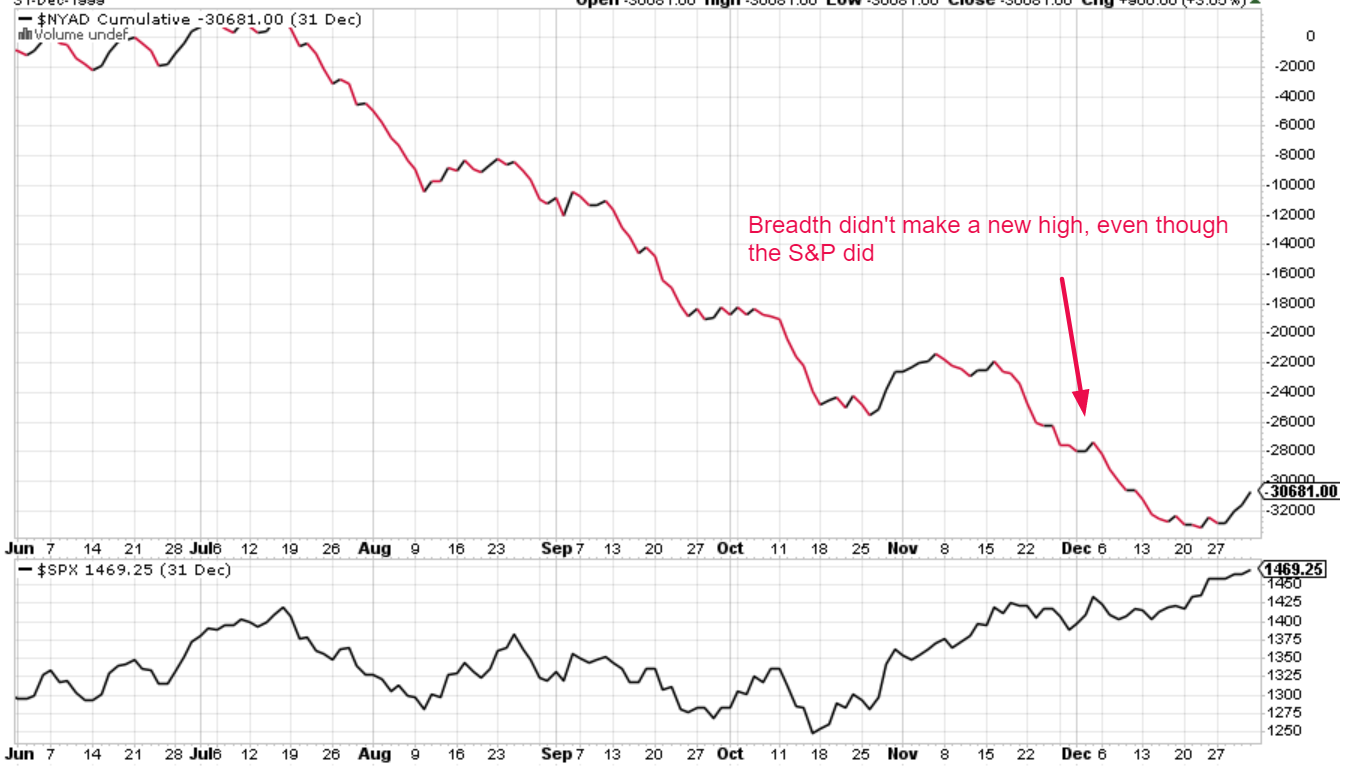
July 19, 1999
The S&P 500 made a new high before the A/D line did. The A/D line did not go on to make a new high.
This historical case does not apply to today because the A/D line has already made a new high.
October 7, 1997
The S&P 500 made a new high before the A/D line did. This historical case does not apply to today because the A/D line has already made a new high.


No Comments