
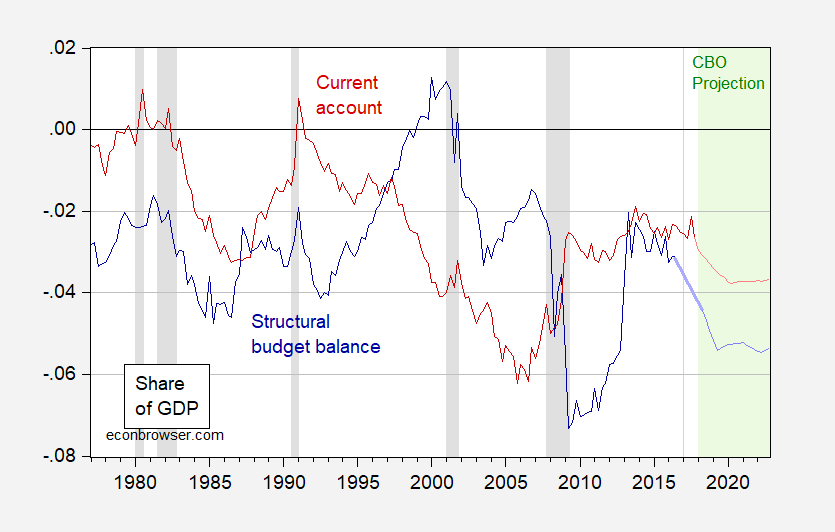
From the recent CBO Budget and Economic Outlook
, the projected current account and implied cyclically adjusted budget balance.

Figure 1: Structural/cyclically adjusted Federal budget balance (dark blue), and current account balance (dark red), both as a share of GDP. NBER defined recession dates shaded gray. CBO projection period shaded gray. Projection of structural budget balance estimated by author using June 2017 estimate, adding in legislative changes reported in CBO (2018). Source: BEA 2017Q4 3rd release, CBO Budget and Economic Outlook
, and author’s calculations.
So, the twin deficits re-appear, as many of us had predicted. Interest rates rise as fiscal policy collides with tighter monetary policy. The IMF released its forecasts in the semi-annual World Economic Outlook, the CBO forecast for the current account deficit is slightly larger than the IMF: 755 vs. 727 in 2019.
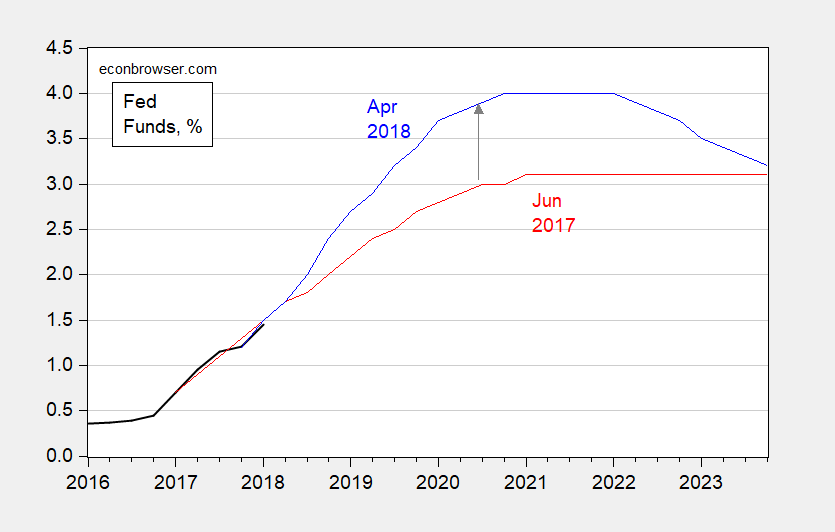
Figure 2: Fed funds actual (black), CBO June 2017 projection (red), CBO April 2018 projection (blue). Source: Federal Reserve via FRED, CBO (2018), CBO (2017).
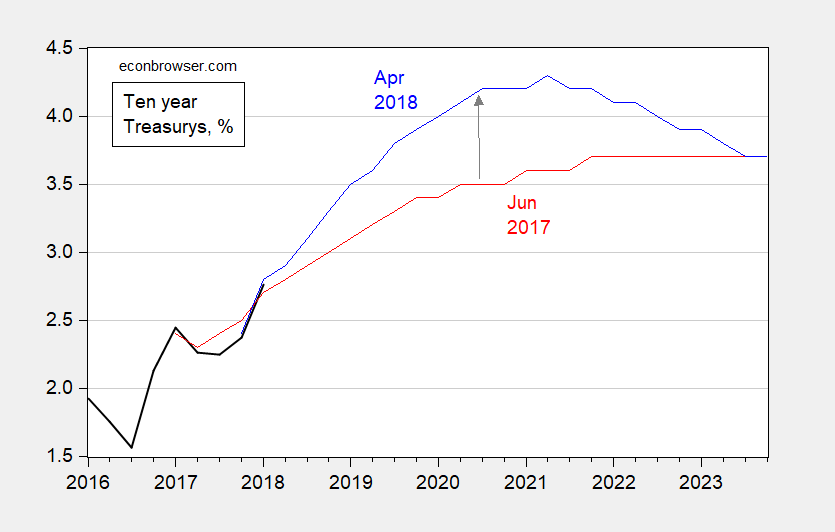
Figure 3: Ten year constant maturity Treasury yields actual (black), CBO June 2017 projection (red), CBO April 2018 projection (blue). Source: Federal Reserve via FRED, CBO (2018), CBO (2017).
In the standard story, the dollar would appreciate. Figure 4 displays the projected trade weight dollar normalized to 2017Q1=0 (in logs), so the dollar is weaker.
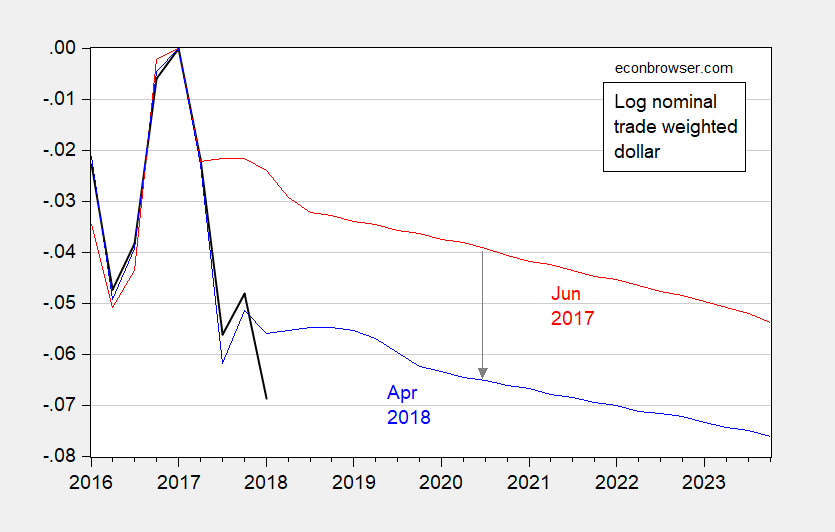
Figure 4: Log nominal trade weighted dollar (black), CBO June 2017 projection (red), CBO April 2018 projection (blue), all normalized to 2017Q1=0. Source: Federal Reserve via FRED, CBO (2018), CBO (2017).
However, most of the change is due to the surprising weakness of the currency over the course of 2017; normalizing to 2018Q1=0, the CBO projects an appreciation — albeit modest — due to the policy mix.
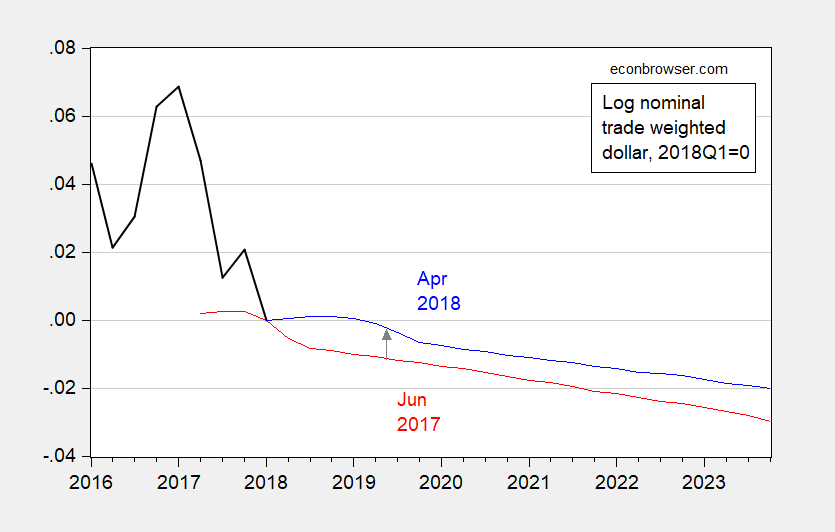
Figure 5: Log nominal trade weighted dollar (black), CBO June 2017 projection (red), CBO April 2018 projection (blue), all normalized to 2018Q1=0. Source: Federal Reserve via FRED, CBO (2018), CBO (2017).


No Comments