

Those that follow my personal account on Twitter will be familiar with my weekly S&P 500 #ChartStorm in which I pick out 10 charts on the S&P 500 to tweet. Typically I’ll pick a couple of themes and hammer them home with the charts, but sometimes it’s just a selection of charts that will add to your perspective and help inform your own view – whether its bearish, bullish, or something else.
The purpose of this note is to add some extra context beyond the 140 characters of Twitter. It’s worth noting that the aim of the #ChartStorm isn’t necessarily to arrive at a certain view but to highlight charts and themes worth paying attention to.
So here’s the another S&P 500 #ChartStorm write-up.
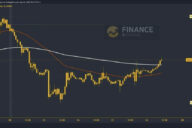
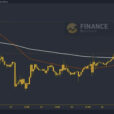
1. An Unfortunate Analog: Analog charts are often interesting and always dubious, but there is obviously merit in looking at historical scenarios and drawing parallels and lessons.In this case the chart, shared by Lance Roberts, and originally featured on Zero Hedge, shows an apparent similarity between today’s market and the 1987 episode. I can’t give an assurance either way on this one, other than saying here it is and make your own mind up.
Bottom line: According to some analysts there are some similarities between now and 1987.
2. Cash Holdings: This good chart shared by Tiho Brkan shows the cash balances of clients at Charles Schwab. It mirrors what we’ve previously shown of AAII portfolio allocation surveys and the implied money market mutual fund allocations as a percentage of total mutual fund assets. In other words, there are numerous sources saying retail has a very low cash allocation. When you think about high valuations across asset classes, it makes you think maybe cash is not as bad as people seem to be implying that it is.
Bottom line: Cash allocations are around all time lows.
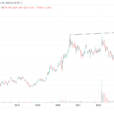
3. Stockmarket Leverage: Nice follow-on from the previous chart, this one shows stockmarket leverage… so not only are cash allocations low, but it looks like punters are even leveraging up. It’s certainly not something you see at the bottom! All up there has been about $400B in leverage added over the past 5 years.


No Comments