Latest Posts
-
Finance 0

Gold Bulls – Gotta Love This Pattern Says Joe Friday
In 2011 the Power of the Pattern suggested that Gold could be flat to down for years to come. See post here. Since that post in 2011, Gold finds itself down around 30% and Silver is down over 65%. 2011 saw extremes in prices. After nearly 7-years of lower prices, could the trend in metals be about to change? Below looks at chart of Gold and the US Dollar over the past 27-years- This chart reflects the “potential” that the US Dollar could be creating a bearish head & shoulders topping pattern, while Gold could be creating bullish inverse head & shoulders bottoming pattern. Joe Friday Just The Facts- The odds might be low that... -
Finance 0

November 2017 Trade Balance Marginally Worsened
Trade data headlines show the trade balance marginally worsened from last month. Analyst Opinion of Trade Data The data in this series wobbles and the 3-month rolling averages are the best way to look at this series. The 3-month averages are increasing for exports and increasing for imports… The data is much worse if one considers inflation is grabbing hold in exports and imports – and the headline numbers are not inflation adjusted. Import goods growth has positive implications historically to the economy – and the seasonally adjusted goods and services imports were reported marginally up month-over-month. Econintersect�... -
Finance 0

5 Profitable Stocks To Buy In January
Profitability analysis is an excellent way to determine the ability of a company to ensure effective cost management and provide healthy returns to its investors. Using this analysis one can identify a profitable company, which generally offers better returns than a loss-making one. Here, we have used the concept of accounting ratios to evaluate a company’s profitability. There is a variety of profitability ratios, from which we have chosen the most common and successful profitability metric to determine the bottom-line performance of a company. Net Income Ratio Net income ratio gives us the exact profitability level of a company. It reflec... -
Finance 0
U.S. Economy Creates 148,000 Jobs In December
The number of jobs created in the world’s largest economy slowed more than forecast in December, despite wage growth picking up slightly. The economy added 148,000 jobs, fewer than the 252,000 (initially reported as 228,000) jobs created in November and 261,000 in October, according to the Labor Department report published on Friday. The unemployment rate remained unchanged at 4.1 percent for the third consecutive month, but wage growth inched slightly higher to 2.5 percent, up from the revised 2.4 percent recorded in November. Economists had expected 190,000 jobs in the last month of 2017, however, Labor Department attributed the dr... -
Finance 0
S&P 500 Grinds Higher, But Correction Looms
Briefly: Intraday trade: Our Thursday’s intraday trading outlook was neutral. It proved partly accurate because the S&P 500 gained 0.4% following higher opening of the trading session (+0.2%). The broad stock market continued its short-term uptrend, but it remained within a relatively narrow intraday trading range. There have been no confirmed negative signals so far. However, we can see some clear short-term overbought conditions along with an overly bullish investors’ sentiment. Therefore, intraday short position is favored today. Stop-loss is at the level of 2,750 and potential profit target is at 2,700 (S&P 500 index... -
Finance 0

Headline US Jobs Disappoint, But Earnings As Expected
The headline US non-farm payrolls disappointed, rising by 148k instead of the consensus of 180k-200k. However, the other details were largely as expected and are unlikely to change views about the trajectory of Fed policy or the general direction of markets. It is a very much steady as she goes story. The headline miss is not really made up for by the upward revision in the November series from 228k to 252k as the October series was revised lower, leaving the two-month revision 9k lower. Still, despite the miss, economists generally expect slower job growth. The unemployment rate was unchanged at 4.1% and the underemployment rate ro... -
Finance 0
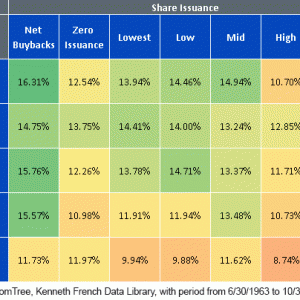
How To Access Shareholder Yield In U.S. Small Caps
In U.S. equities, investors love the idea of small-cap stocks. Some of these companies represent the entrepreneurial spirit, and it’s no secret that many investors dream of the “lottery-like” experience of finding the next Facebook, Amazon, Netflix or Google before it becomes a giant company—collecting stratospheric returns along the way. More Realistic Strategies in U.S. Small Caps Of course, the chance of finding such blockbuster firms early in their life cycles is extremely low, and we think it would be difficult for most investors to build strategic allocations with that type of thinking. Fortunately, history has shown that cert... -
Finance 0
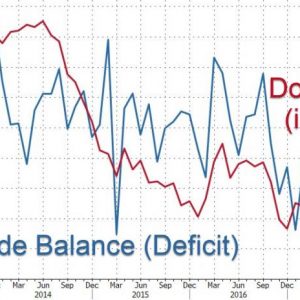
Trade Deficit Spikes To 6-Year High Despite Tumbling Dollar
Don’t show President Trump this chart… While the equity markets are exuberant, today’s payrolls data suggests all is not awesome, and the US trade balance print is just terrible. Despite the relative freefall in the US Dollar, the US trade deficit disappointed expectations, spiking above $50 billion. This is the biggest trade deficit since January 2012. Imports rose 2.5% to a record $250.7b on more inbound shipments of consumer goods and industrial supplies. Exports climbed 2.3% to an all-time high of $200.2b, led by increased shipments of automobiles, consumer merchandise and capital goods including commercial aircraft.... -
Finance 0
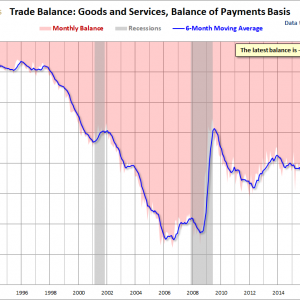
November Trade Deficit At $50.5B, Down 3.2% MoM
The U.S. International Trade in Goods and Services, also known as the FT-900, is published monthly by the Bureau of Economic Analysis with data going back to 1992. The monthly reports include revisions that go back several months. This report details U.S. exports and imports of goods and services. The Bretton Woods agreement, which established a stable foreign currency exchange system collapsed in 1971 and as a result, currency values began to float freely and the US dollar was no longer tied to gold values. Since 1976, the United States has had an annual negative trade deficit. The International Monetary Fund and the International Bank for ... -
Finance 0
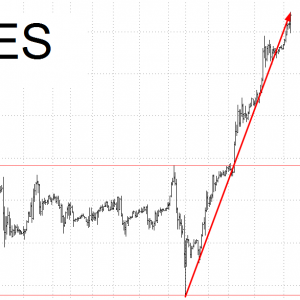
Straight Up
Good jobs report, bad jobs report, it doesn’t matter. Here’s how the market has behaved since that tiny sell-off at the end of 2017: ………and……….. Nice going, Woody....
Top Posts
-
 The Importance for Individuals to Use Sustainable Chemicals
-
 Small Businesses: Finding the Right Candidate for the Job
-
 How to Write the Perfect Thank You Letter After Your Job Interview
-
 3 Best Large-Cap Blend Mutual Funds For Enticing Returns
-
 China suspected in massive breach of federal personnel data