


Latest Posts
-
Finance 0
How To Access Shareholder Yield In U.S. Small Caps
In U.S. equities, investors love the idea of small-cap stocks. Some of these companies represent the entrepreneurial spirit, and it’s no secret that many investors dream of the “lottery-like” experience of finding the next Facebook, Amazon, Netflix or Google before it becomes a giant company—collecting stratospheric returns along the way. More Realistic Strategies in U.S. Small Caps Of course, the chance of finding such blockbuster firms early in their life cycles is extremely low, and we think it would be difficult for most investors to build strategic allocations with that type of thinking. Fortunately, history has shown that cert... -
Finance 0
Trade Deficit Spikes To 6-Year High Despite Tumbling Dollar
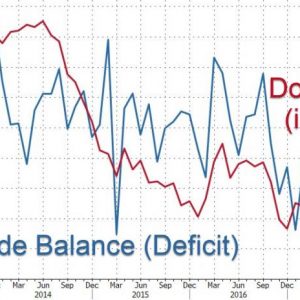
Don’t show President Trump this chart… While the equity markets are exuberant, today’s payrolls data suggests all is not awesome, and the US trade balance print is just terrible. Despite the relative freefall in the US Dollar, the US trade deficit disappointed expectations, spiking above $50 billion. This is the biggest trade deficit since January 2012. Imports rose 2.5% to a record $250.7b on more inbound shipments of consumer goods and industrial supplies. Exports climbed 2.3% to an all-time high of $200.2b, led by increased shipments of automobiles, consumer merchandise and capital goods including commercial aircraft.... -
Finance 0
November Trade Deficit At $50.5B, Down 3.2% MoM
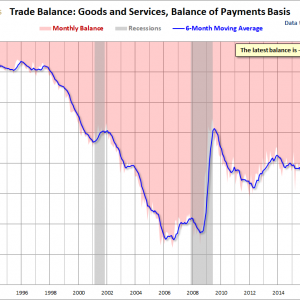
The U.S. International Trade in Goods and Services, also known as the FT-900, is published monthly by the Bureau of Economic Analysis with data going back to 1992. The monthly reports include revisions that go back several months. This report details U.S. exports and imports of goods and services. The Bretton Woods agreement, which established a stable foreign currency exchange system collapsed in 1971 and as a result, currency values began to float freely and the US dollar was no longer tied to gold values. Since 1976, the United States has had an annual negative trade deficit. The International Monetary Fund and the International Bank for ... -
Finance 0
Straight Up
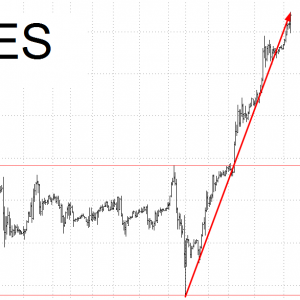
Good jobs report, bad jobs report, it doesn’t matter. Here’s how the market has behaved since that tiny sell-off at the end of 2017: ………and……….. Nice going, Woody.... -
Finance 0
Weekend Reading: The “Brawny” Market
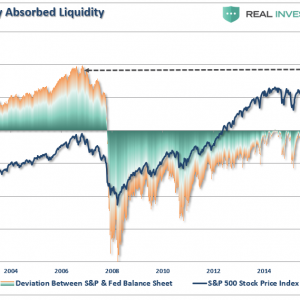
Yesterday, as I was researching the data on the Fed’s balance sheet as it relates to the future direction of interest rates, I stumbled across an interesting piece of analysis. The chart below shows the deviation of the market from the underlying liquidity provided by the Fed’s balance sheet. Not surprisingly, in 2006-2007 as the deviation reached extremes, market liquidity became problematic. While we only recognized this in hindsight, the correlation is important to consider. Currently, this “Brawny Market” has become the “quicker picker-upper” of market liquidity. The issue becomes, as discussed yesterday, with the Fe... -
Finance 0
Opportunity Coming For Those Who Are Ready
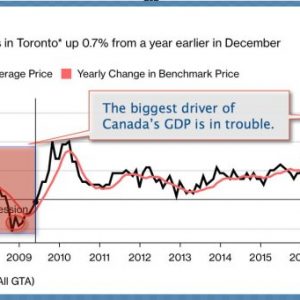
While still up .7% over the last year, Toronto home prices fell for the 7th consecutive month in December, down 8.9% since May–the largest seven-month decline in data tracked since 2000. Falling 3.5% since November, the average sale price in Toronto is still–a wildly un-affordable for most–$735,021 ($1.2 million for single detached homes.) See Toronto home prices fall for seventh month as lending tightens. Here is the chart. Still with Canadian households at record indebtedness, and new lending restrictions just biting this month, the long overdue slowdown in the real estate sector is barely just started in Canada. The economy which h... -
Finance 0

Opportunity Coming For Those Who Are Ready
While still up .7% over the last year, Toronto home prices fell for the 7th consecutive month in December, down 8.9% since May–the largest seven-month decline in data tracked since 2000. Falling 3.5% since November, the average sale price in Toronto is still–a wildly un-affordable for most–$735,021 ($1.2 million for single detached homes.) See Toronto home prices fall for seventh month as lending tightens. Here is the chart. Still with Canadian households at record indebtedness, and new lending restrictions just biting this month, the long overdue slowdown in the real estate sector is barely just started in Canada. The economy which h... -
Finance 0

Rail Week Ending December 30, 2017: 2017 Was A Relatively Good Year
Week 52 of 2017 shows same week total rail traffic (from same week one year ago) contracted according to the Association of American Railroads (AAR) traffic data. The economically intuitive sectors remain in expansion, but the decline in the last week of the year negatively affected all the averages. Analyst Opinion of the Rail Data We review this data set to understand the economy. If coal and grain are removed from the analysis, this week it declined 8.0 % (meaning that the predictive economic elements worsened year-over-year). The decline likely was due to a holiday mismatch between 2016 and 2017 – and that is why we primarily use ... -
Finance 0
Canada Gains Another Whopping 78.6K, Unemployment Falls To 5.7% – USD/CAD Crashes
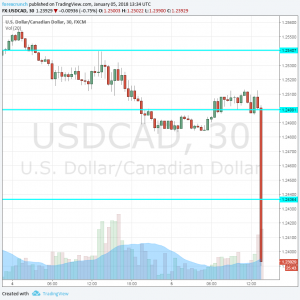
A second consecutive month of excellent jobs figures from Canada: 78.6K jobs gained and the unemployment rate falls to 5.7%. This comes on top of a similar report for November. The participation rate is also up to 65.8%. Wages are up 2.7%, slightly higher than in the US. USD/CAD crashes to 1.2374. Here is the move on the chart, quite impressive: Only the trade balance missed with a deficit of 2.5 billion. Yet the Canadian economy seems to be on fire and the loonie likes it. Canada was expected to show a minor rise of 1000 jobs in December after a whopping jump of 79.5K in November. Back then, the unemployment rate dropped to 5.9% and i... -
Finance 0

Cisco Upgraded To Buy On Software Transition, Valuation At BofA/Merrill
As previously reported, BofA Merrill Lynch analyst Tal Liani upgraded Cisco (CSCO) to Buy from Neutral, as he sees the company being in the early stages of a positive transition to software. While noting the strategy shift is not new, Liani said he is also incrementally more positive on Cisco’s stability following years of software-defined networking and public cloud uncertainty. The analyst, who also points out that Cisco still trades at a valuation discount to its peers, raised his price target on the shares to $46 from $37. ...
Top Posts
-
 The Importance for Individuals to Use Sustainable Chemicals
-
 Small Businesses: Finding the Right Candidate for the Job
-
 How to Write the Perfect Thank You Letter After Your Job Interview
-
 3 Best Large-Cap Blend Mutual Funds For Enticing Returns
-
 China suspected in massive breach of federal personnel data
New Posts

Cannabis Stocks Dropped 19%, On Average, In Last 3 Days Of This Week

GBP/JPY Floundered Near 192.00 After Suspected BoJ Interventions Flattened Markets
Alamos Gold: With Mining Stocks On The Move, This Growing Gold Producer Should Shine

4 Factors Point To A Sunny Future In Solar
Forex And Cryptocurrencies Forecast For May 6-10