


Latest Posts
-
Finance 0
Stocks Have A Great Week Despite Subpar Labor Report
The main reason investors have been cautious heading into this week was because of the potential for a North Korean flare up. It turned out that the market decided to ignore the North Korean risk as the last week before Labor Day, when most people go on vacation, was fantastic. The Nasdaq was up 2.75% which was the best weekly gain since December 2016. This was led by Apple which was up 2.62% this week. It now has an $847 billion market cap. The event which will unveil the new iPhone will be September 12th, meaning your window to sell it if you’re a short-term trader is closing. Friday was the beginning of September which usually means bad ... -
Finance 0

Speculators Make Minor Position Adjustments, But Like That Aussie
Speculators did not make any significant adjustment to gross positions, which we define as 10k or more contracts in the currency futures, during the CFTC reporting week ending August 29. However, the Australian dollar bulls came close by adding 9.4k contracts to the gross long position. It stood at 101k contracts, which is the highest since April 2016. The gross Aussie long position has tripled since the middle of June. The gross short position increased by 3.4k contracts to 34.4k. The net long speculative position of 66.5k, the largest in four years. We track 16 gross positions of large speculators. In the latest reporting period, 13... -
Finance 0
A 5-Star Dividend Achiever ETF That’s Flying Under The Radar
There are a lot of dividend ETFs out there to choose from, but this segment of the marketplace is fairly concentrated. Of the 170 ETFs categorized as dividend ETFs by ETFdb.com, just a dozen have more than $2 billion in assets. In other words, just a handful of dividend ETFs get most of the attention. That’s kind of a shame because there are a number of solid, high performing dividend ETFs with relatively small asset bases that are just as strong, if not stronger, that aren’t getting a lot of notice. One of those funds is the First Trust Rising Dividend Achievers ETF (RDVY). At 3½ years old, the fund has roughly $250 million in assets. ... -
Finance 0
ECRI Weekly Leading Index: “Finding The Root Cause Of Recessions”
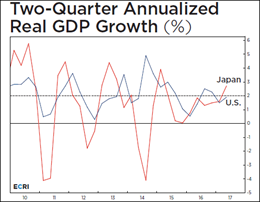
Friday’s release of the publicly available data from ECRI puts its Weekly Leading Index (WLI) at 143.9, down from the previous week. Year-over-year the four-week moving average of the indicator is now at 4.36%, down from 4.63% last week. The WLI Growth indicator is now at 1.9, also down from the previous week. “Finding the Root Cause of Recessions” ECRI’s latest headline article digs into the causes of recent recessions after the 2008 financial crisis. Specifically, comparisons are made between US and Japanese economic growth, economic vulnerability, and exogenous shocks. ECRI concludes that while US GDP has been ex... -
Finance 0
Palladium Suddenly Spikes To 16-Year Highs
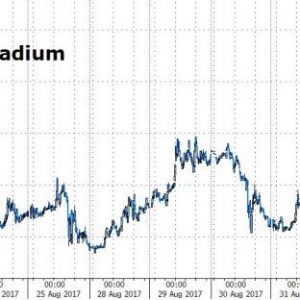
Amid hope for reinvigorated auto production (after Hurricane Harvey’s destruction) and Thursday’s escalation in US-Russia tensions (Russia being the world’s largest producer), spot Palladium was spiking on Friday, hitting its highest since record highs in January 2001. While the entire gamut of industrial and precious metals have been rising recently (the latter on the back of Chinese demand hype), Palladium prices exploded today out of nowhere (biggest jump in 7 months). Pushing the precious metal to its highest in 16 years… There appear to be a few catalysts for the recent trend and Friday’s spike…... -
Finance 0
USDCHF Rejects Lower Prices, Eyes The 0.9772 Zone
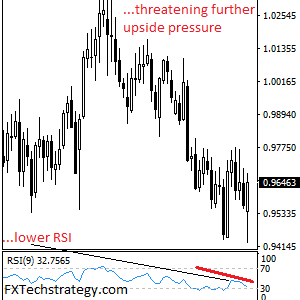
USDCHF: With the pair backing off lower prices to close higher the past week, more strength is envisaged in the days ahead. On the downside, support lies at the 0.9600 level. A turn below here will open the door for more weakness towards the 0.9550 level and then the 0.9500 level. On the upside, resistance resides at the 0.9700 level where a break will clear the way for more strength to occur towards the 0.9750 level. Further out, resistance comes in at the 0.9800 level. Above here if seen will turn attention to 0.9850. All in all, USDCHF faces further upside pressure on corrective recovery.... -
Finance 0

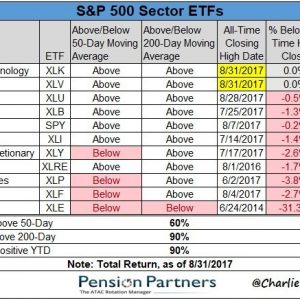
Long Over The Long Weekend
Seems traders took Friday off as we saw low volume and anemic action before start of the long weekend. The action remains looking very positive. Let’s enjoy the long weekend and see how trade resumes next week. SPY couldn’t get past the 248 resistance level but let’s see what comes next week. We should continue higher. Enjoy the wonderful and deserved long weekend.... -
Finance 0
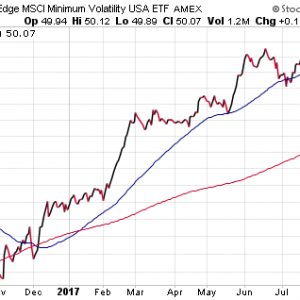
EC HH The Ins And Outs Of Low Volatility ETFs
If there’s one thing investors love, it’s consistency and reliability. Two attributes that deftly describe the trend of exchange-traded funds that track low volatility stocks. This unique category of the ETF universe has rapidly expanded in recent years through a combination of persistent fund flows and sector momentum. The factors that ultimately shape low volatility indexes have proven to offer attractive characteristics for conservative investors that want equity exposure without the downside risk of a typical broad-based benchmark. One leading fund in this group is the iShares Edge MSCI Min Vol USA ETF (USMV), which has amassed near... -
Finance 0
Gold Breakout & Upside Targets
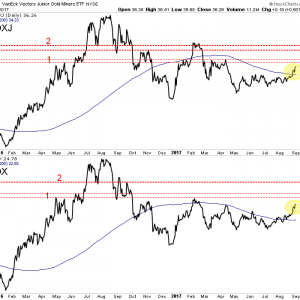
Gold cleared $1300 early in the week and padded its gains on Friday even amid a bullish weekly reversal in the US Dollar. Gold’s breakout was validated by a strong monthly close on Thursday and then a strong weekly close Friday. As predicted, the miners perked up with the breakout in Gold. GDX and GDXJ gained nearly 6% and 7% respectively for the week. Look for the miners to continue to trend higher as Gold attempts to retest its 2016 highs around $1375/oz. The miners (GDX and GDXJ) have more immediate upside potential. The daily line charts show two levels of resistance. The first level is around $26 for GDX and $38 for GDXJ while the seco... -
Finance 0
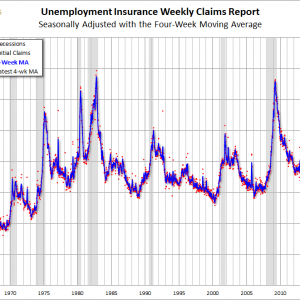
The Civilian Labor Force, Unemployment Claims And Business Cycle
Every week we post an update on new unemployment claims shortly after the BLS report is made available. Our focus is the four-week moving average of this rather volatile indicator. The financial press generally takes a fairly simplistic view of the latest number, and the market often reacts, for a few minutes or a few hours, to the initial estimate, which is always revised the following week. One of our featured charts in the update shows the four-week moving average from the inception of this series in January 1967. The chart, above, however, gives a rather distorted view of Initial Claims. Why? Because it’s based on a raw, albeit se...
Top Posts
-
 The Importance for Individuals to Use Sustainable Chemicals
-
 Small Businesses: Finding the Right Candidate for the Job
-
 How to Write the Perfect Thank You Letter After Your Job Interview
-
 3 Best Large-Cap Blend Mutual Funds For Enticing Returns
-
 China suspected in massive breach of federal personnel data
New Posts

Cannabis Stocks Dropped 19%, On Average, In Last 3 Days Of This Week

GBP/JPY Floundered Near 192.00 After Suspected BoJ Interventions Flattened Markets
Alamos Gold: With Mining Stocks On The Move, This Growing Gold Producer Should Shine

4 Factors Point To A Sunny Future In Solar
Forex And Cryptocurrencies Forecast For May 6-10