


Latest Posts
-
Finance 0
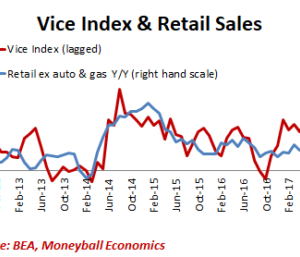
Vice Index Nails Retail Forecast Again
Heads Up: Retail Spending Momentum Turns Negative (Note: The Vice Index is lagged: recent vice spending pullbacks are reflected in the chart above starting June.) Consumer Spending Slowing Down Regular readers know the Vice Index is the real way to measure the breadth of the U.S. consumer. It factors in many disposable spending habits like alcohol, marijuana, prostitution and gambling. Everyone knows consumer spending (including disposable spending) is the lifeblood of the US economy. There are different but related measurements: Disposable Income is personal income minus taxes. Personal Consumption Expenditures (PCE) is disposable income min... -
Finance 0
Market Overview – Thursday, July 27
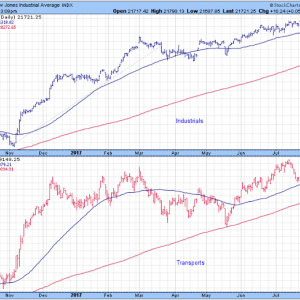
Huge breakdown for the Transports, but barely a peep out of the Industrials. It isn’t a good sign for the broad market, and coming at a time when seasonal weakness is just starting. The short-term trend has probably peaked. Something was up with the market today right from the open. The bullish percents were all pointing lower. The Leader List Strong: Energy, Retail. Weak: too many to mention them all. Transports, Pharmaceuticals broke down below their 50-day averages. Yesterday I wondered whether this Energy rally was for real. Well this now looks promising. This doesn’t look good. Health Care dropped off the leader list. Semicon... -
Finance 0

Market Talk – Thursday, July 27
The Nikkei managed to reverse the majority of the days trend with an eventual positive close. It was not that great (+0.15%) but a positive close none the less and as the yen played just under the 112 handle, this helped the move at the close. The FED played its part initially but as the trading day wore on dealers are starting to question the recent run on the Euro especially as the watched the Swissy breaking new lows. We saw the Swiss Franc trade back to 2015 lows as talk surrounds a move away from the region in favour of the USD. Shanghai saw a similar performance to Japan with a small (+0.05%) positive close. The Hang Seng again the bett... -
Finance 0
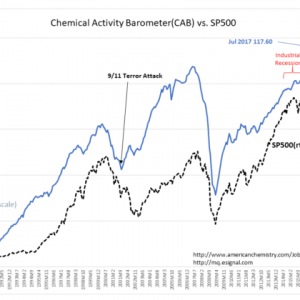
Chemical Barometer Predicted The Earnings Surge We Are Seeing
“Davidson” submits: CAB hit new high this week, the earnings surge predicted by this index 14mos ago in US Industrial Sector is being reported today. Firms such as Chart Inds are providing insight to how strong the recovery has been from the 2014-2016 Industrial Recession which occurred as a result of the strong US$. The US$ further weakened overnight and hit new 2yr lows. US Industries which export should continue to reflect earnings surprises. From Chart Inds 2Q17 Press Release: “E&C orders increased 70% over the first quarter of 2017, driven by natural gas demand in both petrochemical and LNG export projects. Specifically, order ... -
Finance 0

Stocks And Precious Metals Charts – Building A Dream
“Seek the Lord, all you humble of the land, who have observed his law; Seek justice, seek humility; And perhaps you will be sheltered on the day of the Lord’s justice. This was the triumphal city, high and mighty, Saying to herself, ‘I am the one, and none dare stand beside me.’ How desolate now has she become, a place fit only for wild beasts. Those who pass by her scoff, and shake their heads at her ruin.” Zephaniah 2:3,15 I have a feeling that we are going to be seeing some real fireworks in the precious metals before the end of the year. But feelings really do not count in markets. But it is there, tempting my trading di... -
Finance 0
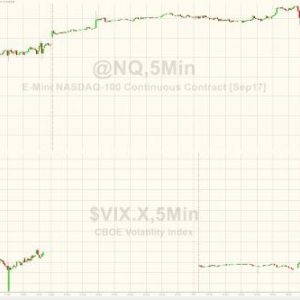
Gold Surges To 6-Week Highs As Stocks Get De-FANGed, Trannies Worst Day Since Brexit
No fundamental catalyst for today’s tech wreck (just as there wasn’t last time), but many people noted the coincidental timing of JPM’s Kolanovic note on Vol fragilities coincided with the start of the pain… Liquidity collapsed leaving many to think… Since The Fed statement, gold is the biggest winner… US equity markets suffered their worst day since June (with Trannies worst day since Brexit)… The Dow was the only index green on the day despite the ramp… VIX spiked above 11… Nasdaq VIX spiked back above 17 intraday and back above Russell 2000 vol.. Jeffrey Gundlach’s DoubleLine Capi... -
Finance 0
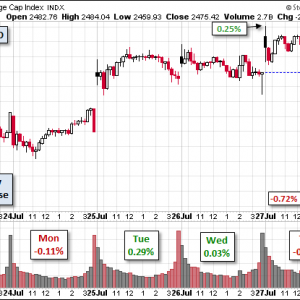
S&P 500 Snapshot: Index Up 10.57% YTD
The S&P opened near its daily high and dropped 24 bps before bouncing back a bit hours before close. The index saw a fractional daily loss of 0.10% and a YTD gain of 10.57%. The U.S. Treasury puts the closing yield on the 10-year note at 2.32%. Here is a daily chart of the S&P 500. Today’s selling puts the volume 28% above its 50-day moving average. Here’s a monthly snapshot of the index going back to December 2007. A Perspective on Drawdowns Here’s a snapshot of record highs and selloffs since the 2009 trough. Here is a more conventional log-scale chart with drawdowns highlighted. Here is a linear scale version of t... -
Finance 0
Prepare For Increased Risk & Reward
Stocks took a violent turn intraday. One of the rumors is someone leaked that AMZN would have a big earnings miss. Regardless we have warned all week about how an earnings miss by 1 of the big 5 stocks can lead to a reversal for the entire market. In tonight’s video we show you one intraday trade we took in the QQQ for a big reward. Watch this video to find out how to prepare for an increase in risk and reward! Video Length – 00:14:18... -
Finance 0

Poor Earnings Reactions
Well, well well. We did see some heavy weakness this afternoon which didn’t last too long but it is always a warning when we see that type of move lower on heavy volume. Sometimes it’s a warning shot across the bow, other times it hits, so time will tell, likely Friday will be that time. AMZN is down tonight as well as SBUX who started higher, so tomorrow may be a gong show in the market and I’ll be doing lots of selling. Things may change overnight but so far the end of this week looks sketchy. SPY looks fine in this normal range action but let’s see how tomorrow goes. Under 246 on a closing basis wouldn’t be great but it may be ha...
Top Posts
-
 The Importance for Individuals to Use Sustainable Chemicals
-
 Small Businesses: Finding the Right Candidate for the Job
-
 How to Write the Perfect Thank You Letter After Your Job Interview
-
 3 Best Large-Cap Blend Mutual Funds For Enticing Returns
-
 China suspected in massive breach of federal personnel data
New Posts
Stocks Hit Major Resistance As Rates And The Dollar Find Key Support – The Week Of May 6

WMA: Bitcoin Back Above $64,000, CZ Gets 4 Months In Prison
Average Credit Score By Age In Canada In May 2024 What is the average credit score in Canada by age?
The Fed, Interest Rates And Jobs Sway The Markets. Which Direction Are We Headed?

Crude Oil Trading Strategy, USWTI Analysis & USWTI Forecast – Sunday, May 5