


Latest Posts
-
Finance 0

Market Timing Using The Dow Jones’ 200 Count
The Dow Jones made its last all-time high (BEV Zero) on August 7, and for the past fourteen trading sessions the Dow, moving in tiny baby steps, hasn’t moved further than 2.01%. Following this market is like watching paint dry, and it’s been that way for weeks. But about the time you believe you have a market figured out, it always goes that someone changes the rules. Somewhere up ahead market volatility will once again dominate the stock market Ahead of us are days where the Dow Jones can, and will move (+/-) 5% or more in a single trading session. It’s called a bear market, so I spent much of this week’s focus on the Dow Jo... -
Finance 0
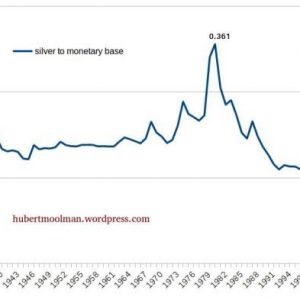
Silver Price Forecast 2018: Dollars Relative To Silver Price Points To Much Higher Prices
Silver is currently trading around $17 an ounce. This is around 34% of its 1980 all-time high of $50. However, this is an incomplete representation of what silver is really trading at, relative to US dollars. When you look at the silver price, relative to US currency (the amount of actual US dollars) in existence, then it is at its lowest value it has ever been. The US monetary base basically reflects the total amount of US currency issued. Originally, the monetary base is supposed to be backed by gold available at the Treasury or Federal Reserve to redeem the said currency issued by the Federal Reserve. This is not the case any more, therefo... -
Finance 0

Which Food Stocks Should You Buy Amid Grocery Industry Woes?
The grocery industry has been grappling with several challenges like stiff competition, and aggressive promotional environment of late. Traditional grocery rivals are strengthening their franchises and outside players are offering alternative outlets for food and other staples. Customers are becoming more inclined toward private label products as they are low-cost alternatives to national brands. Food deflation had added to the woes over the last one year where oversupply in some types of food — particularly meat, poultry and dairy — dragged prices lower and forced grocery stores into more aggressive promotions. However, the scenario is n... -
Finance 0
Gold Prices Press Higher As Yellen Remains Mute On Policy – NFP On Tap
Fundamental Forecast for Gold: Neutral Gold prices eye fresh yearly highs as Yellen offers no policy guidance What’s driving gold prices? Review DailyFX’s New 3Q Gold Projections Gold prices were higher last week with the precious metal up 0.48% to trade at 1288 ahead of the New York Close on Friday. Price action last week remained uninspiring until Friday’s Jackson Hole event fueled a brief surge in volatility. The gains come on the back of persistent weakness in the greenback with the DXY trading just above the yearly lows into the close of the week. Remarks made by Federal Reserve Chair Janet Yellen at the annual Jackson Hole Eco... -
Finance 0

“Time To Dump U.S. Stocks?”
This week the cover of Barron’s had as one of its headlines “Time To Dump Stocks?” This should not be ignored. Having been an avid Barron’s reader for 3 decades, I would describe such headlines as… …not usually very timely, …frequently correct, …and usually a good indication of institutional sentiment. With that in mind, consider the fact that SPY, DIA and QQQ are all sitting on or near their 50-day moving averages, while the IWM is sitting just below its 200-day moving average. In short, every major index is at an inflection point that institutions tend to respect as good areas to dump or buy stocks. Last week’s market acti... -
Finance 0
Uptrend Resumption Or Rally Fizzle?
Current Position of the Market SPX Long-term trend: The uptrend should continue after pausing for a correction. SPX Intermediate trend: “An ending pattern appears to be in its last stages of completion. This should be followed by an intermediate term correction into October.” The correction has started. Market Overview: After the 20-wk (40-wk?) cycle made its low on 8/21 (date adjusted from 8/10), SPX started a counter-trend rally — or a b-wave, after the a-wave low of 2417, if you prefer — and there is no conclusive sign that this rally is over. Most of the short-term indicators are still biased upwardly, and until we break t... -
Finance 0
Matt King: Global QE And “ETFs Everywhere” Have Created An Unstable, One-Way Market
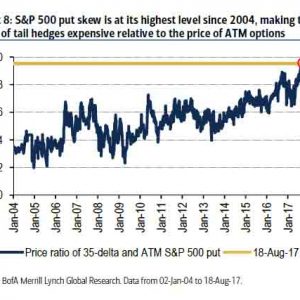
While the financial industry remains divided over what precisely is the cause of the malaise that affects modern markets, characterized by plunging volumes and trading activity, record low volatility and dispersion, a relentless ascent disconnected from fundamentals, and generally a sense of foreboding doom, manifested by an all time high OMT skew – or record high price for crash insurance – as discussed previously… … it can agree on one thing: it has something to do with the interplay of QE, the artificial force that has disconnected market prices from values for the past 8 years, and ETFs, which as some prominent in... -
Finance 0
E The Greek Economy Is Finally Growing Again, But Not Very Quickly
“Greece, long Europe’s economic problem child, is trying to prove that it has made progress in its recovery efforts by announcing plans to sell debt for the first time in years. The proposed bond sale, the details of which were released on Monday, offered hope that Greece might at last be preparing to wean itself off the international bailouts totaling 326 billion euros, or about $380 billion, that it has relied on since 2010 to stay afloat. The sale is a pivotal moment in the painfully fought efforts of Greece to recover from troubles stemming from the financial crisis that began on Wall Street nearly a decade ago and that at one point�... -
Finance 0
Risks For This Asset Class Are Asymmetrically Skewed To The Downside
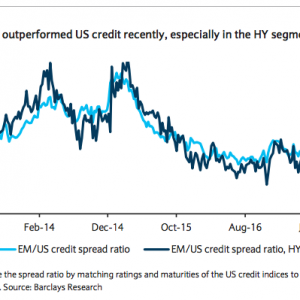
Just a quick note on emerging markets. We’ve talked a lot lately about the extent to which EM credit weathered the storm a bit better than HY this month as Trump turmoil and heightened risk on the Korean peninsula catalyzed a bout of risk-off sentiment – or, perhaps more appropriately, “what counts as risk-off sentiment these days.” This is a pretty important dynamic to keep track of. Generally speaking, a lot of the jitters we’ve seen in August are tied to Donald Trump and it’s no secret that his insistence on pissing off lawmakers is creating considerable uncertainty around the fiscal outlook in the U.S. That, in turn, has wei... -
Finance 0
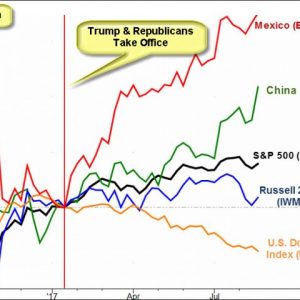
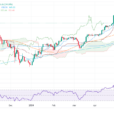
The Best Trump Trade Wasn’t Made In America
Sometime a picture says it all. This week’s Market Outlook commentary is simply the observation you choose to find in this chart. All politics aside (although they are likely the driving force behind these trends). The chart illustrates the percent change trends of key markets since President Trump’s inauguration.In an effort to avoid misrepresenting the longer time frame which should include election day, that time frame is also included so you can see how the assets traded after the election. As you’ll read below, this week’s video is filled with some interesting market development from what may have appeared to be an uneventful wee...
Top Posts
-
 The Importance for Individuals to Use Sustainable Chemicals
-
 Small Businesses: Finding the Right Candidate for the Job
-
 How to Write the Perfect Thank You Letter After Your Job Interview
-
 3 Best Large-Cap Blend Mutual Funds For Enticing Returns
-
 China suspected in massive breach of federal personnel data
New Posts
SP500 Analysis & S&P500 Price Prediction Forecast – Saturday, May 18

A Trade Sets Up In QuickLogic (QUIK) Discussion QuickLogic’s Revenue is volatile quarter-to-quarter but up sizeably from last year QuickLogic’s Q1 2024 margins and earnings improve Looking ahead

All 7 Artificial Intelligence (AI) Categories Reversed Direction This Week
USD/JPY Price Analysis: Extends Gains But Remains Below 156.00 JAPANESE YEN PRICE TODAY
Bad News Sends Markets To All-Time Highs