Latest Posts
-
Finance 0
“It Feels Like An Avalanche”: China’s Crackdown On Conglomerates Has Sent A “Shock Wave” Across Markets
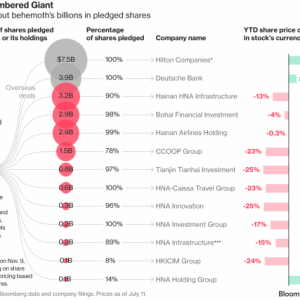
The first to suffer Beijing’s crackdown against China’s private merger-crazy conglomerates, wave was the acquisitive “insurance” behemoth, Anbang, whose CEO Wu Xiaohui briefly disappeared as the Politburo made it clear that the “old way” of money laundering – via offshore deals – is no longer tolerated. Then, several weeks later and shortly after the stocks of the “famous four” Chinese conglomerates plunged after China officially launched a crackdown on foreign acquirers amid concerns of “systemic risk”, it was HNA’s turn, which as we described last week, risks be... -
Finance 0
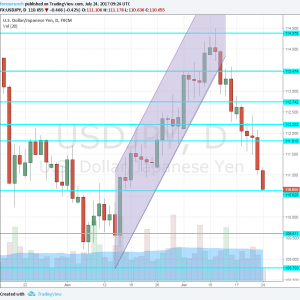
USD/JPY Falls To Low Support, Death Cross In Play
The downfall of the dollar continues and today it is quite pronounced in the pair that usually best reflects US developments. USD/JPY is trading just above support at 110.60. The line formed part of the steep uptrend channel that the pair was riding on, all the way to 114.50. When the pair moved out of the channel, the pair began falling and falling. Further support awaits at 109.60, followed by the place where the line began: 108.80. The cycle low is 108.10. Resistance is at 111.80. Another technical factor to note is the death cross. Since the 50-day moving average slipped below the 200-day moving average, the pair is following the paral... -
Finance 0
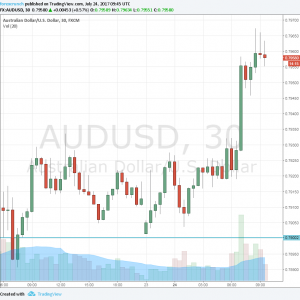
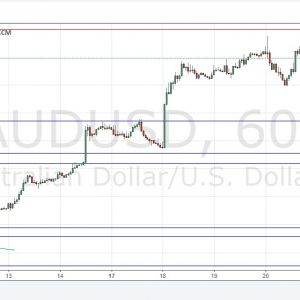
AUD/USD A Big Gainer – Is 0.80 In Play?
A new week begins with new weakness in the US dollar. USD/JPY is at the lowest in a month, USD/CAD is looking at the lows and even GBP/USD is recovering. The Australian dollar stands out with the largest percentage-wise gains. AUD/USD is trading around 0.7960, still below the spike high of 0.7987 that was recorded last week. Can it make it to the very round number of 0.80? The Aussie jumped higher on the hawkish meeting minutes from the RBA. An attempt to play them down did little harm to the Aussie. However, a risk for further advances may come from the central bank. They certainly do not want to see a strong A$. The RBA officials will h... -
Finance 0
Above The 40 – A Stock Market Soaring High But On The Edge
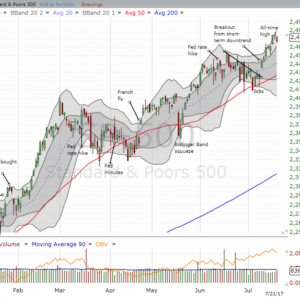
Commentary The S&P 500 (SPY) is soaring high since its impressive breakout two weeks ago. The S&P 500 (SPY) is holding onto significant moment since its last breakout: the upper-Bollinger Bands (BBs) define the latest uptrend. The Nasdaq and PowerShares QQQ ETF (QQQ) have charts very similar to the S&P 500. Unfortunately, the stall of the last two trading days happened to occur right at the edge of the overbought threshold. AT40 (T2108), the percentage of stocks trading above their respective 40-day moving averages (DMAs), closed at 68.2% on Wednesday, June 19th. AT40 got as high as 68.9% the next day. On Friday, AT40 closed at 64... -
Finance 0
AUD/USD Forex Signal – Monday, July 24
Last Thursday’s signals were not triggered as none of the key levels were ever reached. Today’s AUD/USD Signals Risk 0.75%. Trades may only be taken between 8am New York time and 5pm Tokyo time, over the next 24-hour period. Short Trade 1 Short entry following some bearish price action on the H1 time frame immediately upon the next touch of 0.8000. Put the stop loss 1 pip above the local swing high. Move the stop loss to break even once the trade is 20 pips in profit. Take off 50% of the position as profit when the trade is 20 pips in profit and leave the remainder of the position to ride. Long Trade 1 Long entry following some bullish p... -
Finance 0

Nifty Hovers Near 10,000 Mark; Energy Stocks Witness Buying
After opening the day marginally higher, stock markets in India have continued their momentum. Presently, they are trading near their all-time high levels. Indian indices are scaling new highs of late. And there’s a flood of liquidity pouring into Indian stock markets in search of higher returns. One of the key factors behind the above flow of liquidity is the downward trend in interest rates. And the demonetisation drive last November accelerated this trend. Indian banks were flushed with liquidity. At the same time, credit offtake was poor. This forced them to cut interest rates on deposits. Interest rates are a key macroeconomic ... -
Finance 0
Monday Market Review
Last week I posted an analysis on Oil and the highs chances it had to get rejected and reverse lower. Oil price made a double top at 47.50$ and got rejected at the Ichimoku daily Kumo (cloud). This was sent to our subscribers: I’m short since 47$ and we could now be starting a new downward wave that could bring Oil to low 40’s…..trend remains bearish. Gold as per our analysis here and here has reached the $1,250-60 area where the first important test for bulls is to be made. I remain longer-term bullish Gold (Since the turn of 2015). The USD/JPY has turned as expected and has already reached our 1st target of 111.25. The USD/JPY i... -
Finance 0
Recent Stock Purchase July 2017
While I remain committed to making at least one purchase every month, it’s clear that my buying frequency has slowed down a bit. It seems that I’m making my buys about every four or five weeks rather than every week or two as I have done earlier this year. This fact just illustrates my continued frustration in finding the “perfect” stock to deploy my fresh capital. My trades last month saw me expand my portfolio holdings in the health/biotech sector as I sought to further diversify my portfolio and, more importantly, my passive income stream. Now, with three weeks already gone in July I felt it was time to pull the trigger and make ... -
Finance 0

German Manufacturing PMI Misses With 58.3 – EUR/USD Ticks Down
Business confidence in Germany still points to robust growth, but slightly weaker than expected. The purchasing managers’ index for the manufacturing sector missed with 58.3 against 59.2 expected. The services PMI slipped from 54.3 to 53.5 points. EUR/USD ticks down just a bit, trading around 1.1644. It remains above the 2016 peak of 1.1620. Further support awaits at 1.1580. Resistance is at the 2015 high of 1.1712. These are the preliminary figures for July. They will be revised early in August. Earlier, French manufacturing PMI beat expectations by scoring 55.4 points against 54.6 expected. On the other hand, the services sector indicato... -
Finance 0
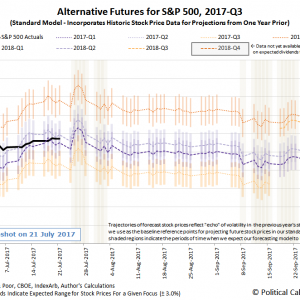
The S&P 500 In Week 3 Of July 2017
In Week 3 of July 2017, the S&P 500 continued to set new all time highs, with the newest peak closing value of 2473.83 set on Wednesday, 19 July 2017. No real surprise there, right? With investors apparently focused on 2018-Q1, the S&P 500 is behaving pretty much as our dividend futures-based forecasting model anticipated. Coming into the fourth week of July 2017, we anticipate that our dividend forecasting model will be affected by the echoes of past volatility in stock prices during this week and the next, where we expect that our model’s projections will fall on the high side of the actual trajectory of the S&P 500. Th...
Top Posts
-
 The Importance for Individuals to Use Sustainable Chemicals
-
 Small Businesses: Finding the Right Candidate for the Job
-
 How to Write the Perfect Thank You Letter After Your Job Interview
-
 3 Best Large-Cap Blend Mutual Funds For Enticing Returns
-
 China suspected in massive breach of federal personnel data