


Latest Posts
-
Finance 0

Meta Platforms: Tripped Up By Concerns On Spending – But Sentiment Remains Bullish
Image Source: PexelsIs there anything more meta than the thing that’s supposed to drive a company’s future growth being the exact thing that trips it up? Because that’s exactly what we saw during this week’s results from Meta Platforms Inc. (META), notes Tom Bruni, head of market research at The Daily Rip by Stocktwits.The stock fell sharply on Thursday despite beating earnings and revenue for the current quarter. That’s because its guidance came in below expectations, and AI spending forecasts have investors concerned about near-term results.Adjusted earnings per share of $4.71 topped the $4.32 expected, as did revenues o... -
Finance 0
Forex And Cryptocurrencies Forecast For April 29 – May 3
Image Source: Unsplash EUR/USD: Inflation Persists, US GDP Growth Slows The US economy remains the most powerful on the planet. Moreover, its share of global GDP has reached a nearly two-decade high of 26.3%. According to the IMF, from 2018, the European Union’s share decreased by 1.4%, Japan’s by 2.1%, while the United States’ increased by 2.3%. China’s GDP is 64% of the American figure, down from 67% five years ago. As a result, the dollar remains the undisputed leader among G10 currencies, with no contenders for its throne in the foreseeable future.The strength of the national economy, coupled with a robust labor m... -
Finance 0
Between The Lines
Image Source: Pexels Key Takeaways The NFIB Small Business Survey has consistently shown pessimistic expectations for sales, the economy, and earnings, but the U.S. economy has performed well despite this pessimism. Adjusting sales for inflation is considered nonsensical, and mentions of “inflation-adjusted revenues” are unlikely to appear in earnings reports. Small businesses have not fully participated in the post-COVID-19 recovery, and their potential involvement could be a significant economic catalyst. Ignoring data can be useful. Because not all data is, in fact, useful. As the number of datasets has proliferated, so too has th... -
Finance 0

ETFs To Buy As Cloud, AI Power Microsoft’s Q3 Earnings
Image: BigstockThe world’s largest software maker — Microsoft (MSFT – Free Report) — reported strong third-quarter fiscal 2024 results, beating earnings and revenue estimates. driven by strong demand for cloud and artificial intelligence offerings.Buoyed by robust results, shares of Microsoft’s stock jumped as much as 5% in after-market hours. Investors could tap the opportunities in this software leader through ETFs having double-digit exposure to Microsoft. Such ETFs include the likes of Select Sector SPDR Technology ETF (XLK – Free Report), MSCI Information Technology Index ETF (FTEC – Free Repo... -
Finance 0

Week Ahead: FOMC, US Jobs, EMU Inflation, JPY Pressure
The backing up of US rates did not broadly lift the dollar as it appeared to have done previously. The dollar-bloc currencies, led by the Australian dollar, advanced last week, while the Swiss franc and Japanese yen were unable to find traction. The Bank of Japan had an opportunity to have protested the yen’s weakness more adamantly, but did not do so.Recognizing the role of interest rate differentials as an important driver, the Ministry of Finance threatens action, but seems reluctant to intervene. Still, the market continues to probe for the official pain threshold. This year, the greenback has generally weakened in the run-up to t... -
Finance 0
Masters In Trading – Saturday, April 27
Image Source: UnsplashIn this recap of the most recent trading session, I review my portfolio and share one of the trades taken this week.00:18:50More By This Author:Masters In Trading – Saturday, April 20Masters In Trading – Saturday, April 13Masters In Trading – Wednesday, April 10... -
Finance 0
Profit From The Growing Demands Of The Power Grid
Image Source: UnsplashEdward Eastman knew he was facing a once-in-a-lifetime opportunity. It was 1888, and the Oregon City banker had heard about the electric revolution sweeping across the country. Oregon City happened to be home to Willamette Falls, a perfect place to generate cheap hydroelectric power.Back in 1888, most power plants were located close to cities because electricity couldn’t be sent very far. When electricity flows through wires, some of it is turned into heat and lost.Unfortunately, there weren’t many people living in Oregon City. So there wasn’t enough demand for all the electricity the river could produce. If only ... -
Finance 0

Economic And Business Impacts Of FTC’s Noncompete Ban
Photo by energepic.com The Federal Trade Commission has banned noncompete clauses in employment contracts. The rule—not a law—is being challenged in federal courts. The economic impacts will not be huge, but they will slow innovation in the economy as businesses seek alternative ways to protect their trade secrets.Initial controversy surrounds wage rates. The FTC claims that noncompetes have suppressed wages, so the ban will boost wages. The contrary view has been expressed, including by Tyler Cowen. The simple idea is that employers and job applicants strike a bargain. If the employer wants a particular term that is not in the employe... -
Finance 0
Technical Market Report – Saturday, April 27
The good news is: Breadth improved along with prices last week. The Negatives The first chart covers the last 6 months showing the Nasdaq composite (OTC) in blue and a 10% trend (19 day EMA) of Nasdaq new highs (OTC NH) in green. Dashed vertical lines have been drawn on the 1st trading day of each month. OTC NH continued falling after failing to confirm the recent index high. The next chart is similar to the one above except it shows the S&P 500 (SPX) in red and NY NH in green has been calculated with NYSE data. NY NH has been falling sharply since confirming the recent all time SPX high. The next chart covers the past 6 ... -
Finance 0
Stagflation Fears? March NBER Business Cycle Indicators And Instantaneous Inflation
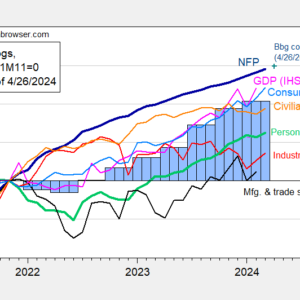
Stagflation is a term that is invoked in a CNN article today. I think of stagflation as weak growth combined with high inflation. A little context:As noted here, advance estimate for q/q GDP growth is 1.6%, below 3.4 consensus. But as discussed here, GDP+ is at 2.6%, and final sales to private domestic purchasers is running 3.0%. In addition we have the following key monthly indicators followed by the NBER’s Business Cycle Dating Committee.Figure 1: Nonfarm Payroll (NFP) employment from CES (bold blue), civilian employment (orange), industrial production (red), personal income excluding current transfers in Ch.2017$ (bold green), manufa...
- « Previous Page
- 1
- …
- 5
- 6
- 7
- 8
- 9
- …
- 4101
- Next Page »
Top Posts
-
 The Importance for Individuals to Use Sustainable Chemicals
-
 Small Businesses: Finding the Right Candidate for the Job
-
 How to Write the Perfect Thank You Letter After Your Job Interview
-
 3 Best Large-Cap Blend Mutual Funds For Enticing Returns
-
 China suspected in massive breach of federal personnel data
New Posts

Tesla’s Autopilot Linked To Hundreds Of Crashes In A New Safety Probe
April Recap: Quantum Computing Hardware Developers Portfolio Down 9%
Economic Data Forecasts For The Weeks Of April 29 & May 6
Crypto Momentum Fading – Are Buy The Dip Opportunities Underway?
Big Picture Technical Update For The Nasdaq 100 – Sunday, April 28