Latest Posts
-
Finance 0
GBP/JPY Breaches 197.00 For The First Time Since 2008
GBP/JPY touched chart territory above 197.00 for the first time since September of 2008 as markets meet the Bank of Japan (BoJ) head-on and batter the Yen into decades-long lows. The BoJ maintained its hyper-easy monetary policy, prompting a broad-market Yen selloff. The Japanese central bank will resume large-scale Japanese government bond purchasing, and BoJ Governor Kazuo Ueda paid lip service with little action on Yen exchange rates, inflation, and interest rate forward guidance in a broadly disappointing BoJ showing.Coming up next week, a light economic calendar from the UK, and an update on Japan’s Retail Sales figures slated fo... -
Finance 0
EUR/JPY Price Analysis: Bullish Run Faces Overbought Risks, Hovers Around 169.00
The EUR/JPY rallies toward the 169.00 figure yet remains shy of breaching it as risk appetite improves, as Wall Street depicts. At the time of writing, the cross-pair trades at 168.89 and is up by 1.12%. EUR/JPY Price Analysis: Technical outlookThe daily chart depicts the EUR/JPY as upward biased, even though the rally has overextended. The Relative Strength Index (RSI) is at 76.00, usually seen as overbought, but due to the strength of the uptrend, the 80.00 level is seen as the most extreme condition.If buyers reclaim the 169.00, the next supply zone would be the July 2008 high of 169.97. Once those two levels are cleared, the next sup... -
Finance 0
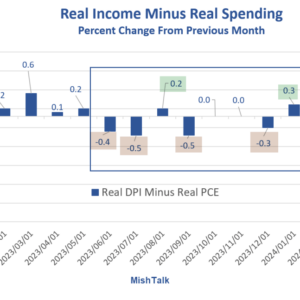
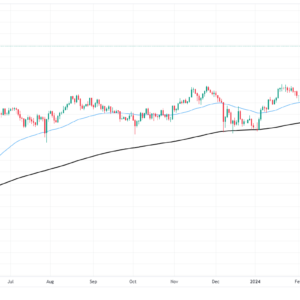
Growth In Spending Exceeds Growth In Income For Most Of The Last 10 Months
A deeper dive into personal income and outlays for March shows significant signs of consumer stress to maintain standards of living. Real Income and spending data from the BEA, chart by MishThis is a follow-up with a couple new charts to my post on Friday, Personal Spending Jumps More than Income in March Income Minus Spending Chart Notes Real means after inflation. DPI means disposable Personal Income after taxes. Only twice in the last 10 months has growth in real income been greater than growth in real spending. Personal Income Four Ways Understanding Personal Income The difference between PI (red) and DPI (blue) is taxes, just over ... -
Finance 0

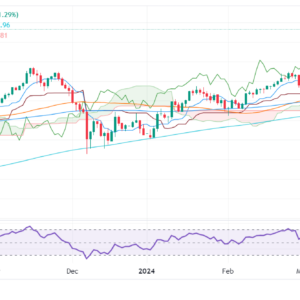
Gold: After Testing Support Around $2,300, Could Bullish March Resume?
Image Source: UnsplashGold seemed to regain its poise after the sharp drop we observed earlier this week. The metal found decent support around the $2,300 level, as traders kept a close eye on bond yields and US data. Overall, not much has changed as far as gold’s long-term bullish outlook is concerned, writes Fawad Razaqzada, technical analyst at TradingCandles.com.With prices no longer severely overbought on the technical front, we have seen a bit of dip-buying again. While the potential for a larger correction is always there, my base case scenario is that dips will be shallow, and we could see repeated all-time highs in the mont... -
Finance 0

5 Stocks In Focus On Their Recent Dividend Hikes
Image: ShutterstockWall Street’s impressive bull run for the last 15 months has been facing severe hurdles in April. Historically, this month is known as being favorable to equity investors. However, it is turning out to be different this year. Month-to-date, the three major stock indexes — the Dow, the S&P 500, and the Nasdaq Composite — have tumbled 3.4%, 3.5%, and 4.1%, respectively.On April 19, both the S&P 500 and the Nasdaq Composite recorded the sixth straight day of negative closing, the longest losing streak for both benchmarks since October 2022. Last week, the S&P 500 fell more than 3%, marking its third straigh... -
Finance 0
This Week’s Massive Data Dump May Send The Dollar And Rates Soaring
Image Source: UnsplashThis week will bring a massive data dump to the market, an FOMC meeting, and a Treasury quarterly Refunding announcement. What will this lead to?00:17:02More By This Author:Nvidia’s Stock May Not Have Much Further To RiseThe 10-Yr Moved Sharply Higher On Surprise GDP ReportStocks Stall Ahead Of Massive Data Dump And Earnings... -
Finance 0

Weekly Market Outlook – To The Brink, But Not Past It
Image Source: PixabayThe bulls answered the call last week, pushing firmly back against the prior week’s rout. That is, the previous week’s 3.0% tumble, the S&P 500 bounced 2.7% last week. It’s a much-needed glimmer of hope.Just don’t grow too hopeful too soon. For all of the effort, the market didn’t actually snap the selloff that began four weeks back. Last week’s gain may only be a dead-cat bounce, ready to yield to the sellers again. We’ll show you why in a moment. Let’s first run through last week’s biggest economic reports and then look at what’s coming this week.Spoiler alert: Hopes for a rate cut in the near f... -
Finance 0
How Long Risk-On?
S&P 500 rejected premarket downswing attempts, and held up pretty well following core PCE data in line with expectations. The interest rate sensitive Russell 2000 was nicely showing the way, and broadening sectoral leadership (with a few flies in the ointment such as XLF retreat) provided enough fuel till profit taking hit before the closing bell.What marvels a little retreat in 10y yield can do – while Sep 25bp rate cut odds at 44% are practically equal to 43% of rates unchanged (and 12.5% odds of Fed funds rate being 50bp lower than it is now). What a journey from six rate cuts expectation in Dec to three cuts months later, and now ma... -
Finance 0

Wall Street’s Top 10 Stock Calls This Week – Saturday, April 27
Image source: PixabayWhat has Wall Street been buzzing about this week? Here are the top 5 buy calls and the top 5 sell calls made by Wall Street’s best analysts during the trading week of April 22-26, 2024. First, here is a look at the top 5 buy calls of the week. 1. Tesla Upgraded to Buy at BofA After Q1 “Clears Deck” of Negative Catalysts BofA upgraded Tesla (TSLA) to Buy from Neutral with an unchanged price target of $220 after the company reported what the firm says were better-than-expected Q1 results. This, coupled with management commentary, addressed key concerns and “revitalized the growth narrative,̶... -
Finance 0
Meta Platforms: Tripped Up By Concerns On Spending – But Sentiment Remains Bullish
Image Source: PexelsIs there anything more meta than the thing that’s supposed to drive a company’s future growth being the exact thing that trips it up? Because that’s exactly what we saw during this week’s results from Meta Platforms Inc. (META), notes Tom Bruni, head of market research at The Daily Rip by Stocktwits.The stock fell sharply on Thursday despite beating earnings and revenue for the current quarter. That’s because its guidance came in below expectations, and AI spending forecasts have investors concerned about near-term results.Adjusted earnings per share of $4.71 topped the $4.32 expected, as did revenues o...
- « Previous Page
- 1
- …
- 3
- 4
- 5
- 6
- 7
- …
- 4100
- Next Page »
Top Posts
-
 The Importance for Individuals to Use Sustainable Chemicals
-
 Small Businesses: Finding the Right Candidate for the Job
-
 How to Write the Perfect Thank You Letter After Your Job Interview
-
 3 Best Large-Cap Blend Mutual Funds For Enticing Returns
-
 China suspected in massive breach of federal personnel data